
- Home >
- Stock Photos >
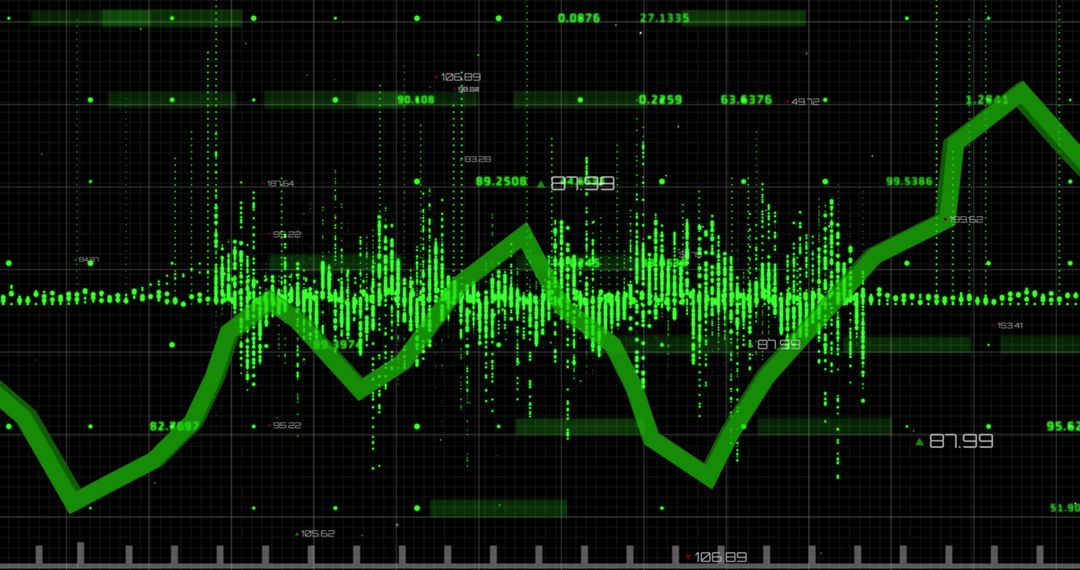
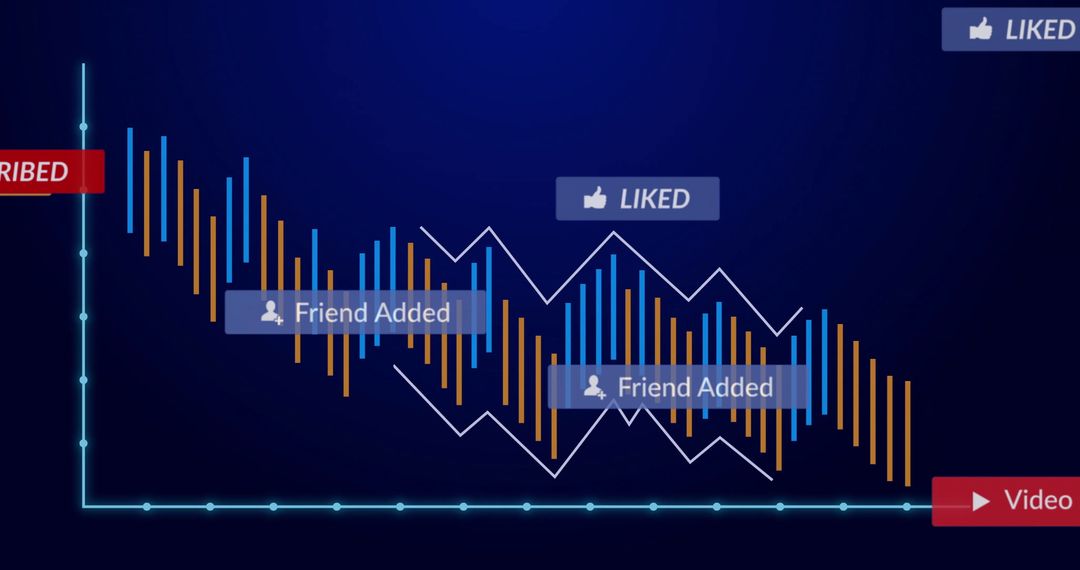
- Minimalist Financial Chart Display on Digital Interface with Gold Frame
Minimalist Financial Chart Display on Digital Interface with Gold Frame Image
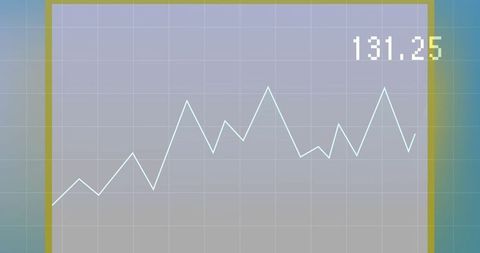
Image showing a minimalist financial chart displayed on a digital interface with a gold frame and grid background. Useful for presentations on data analytics, technological advancements in finance, or budgeting tools. Can effectively represent ideas in reports related to market trends, investment strategies, and economic analysis. Ideal for use in applications, websites, and other digital mediums showcasing tech-driven solutions.
Powered by  - Get 15% off with code: PIKWIZARD15


0
downloads
downloads
Tags:
More
Credit Photo
If you would like to credit the Photo, here are some ways you can do so
Text Link
photo Link
<span class="text-link">
<span>
<a target="_blank" href=https://pikwizard.com/photo/minimalist-financial-chart-display-on-digital-interface-with-gold-frame/d5a187dac5588171e1033a2aab380a3b/>PikWizard</a>
</span>
</span>
<span class="image-link">
<span
style="margin: 0 0 20px 0; display: inline-block; vertical-align: middle; width: 100%;"
>
<a
target="_blank"
href="https://pikwizard.com/photo/minimalist-financial-chart-display-on-digital-interface-with-gold-frame/d5a187dac5588171e1033a2aab380a3b/"
style="text-decoration: none; font-size: 10px; margin: 0;"
>
<img src="https://pikwizard.com/pw/medium/d5a187dac5588171e1033a2aab380a3b.jpg" style="margin: 0; width: 100%;" alt="" />
<p style="font-size: 12px; margin: 0;">PikWizard</p>
</a>
</span>
</span>
Free (free of charge)
Free for personal and commercial use.
Author: Creative Art
Similar Free Stock Images

Premium


Premium


Premium


Premium


Premium


Premium


Premium


Premium


Premium


Premium


Premium


Premium


Premium


Premium


Premium


Premium


Premium


Premium


Premium


Premium


Premium


Premium


Premium


Premium

