- Home >
- Stock Photos >
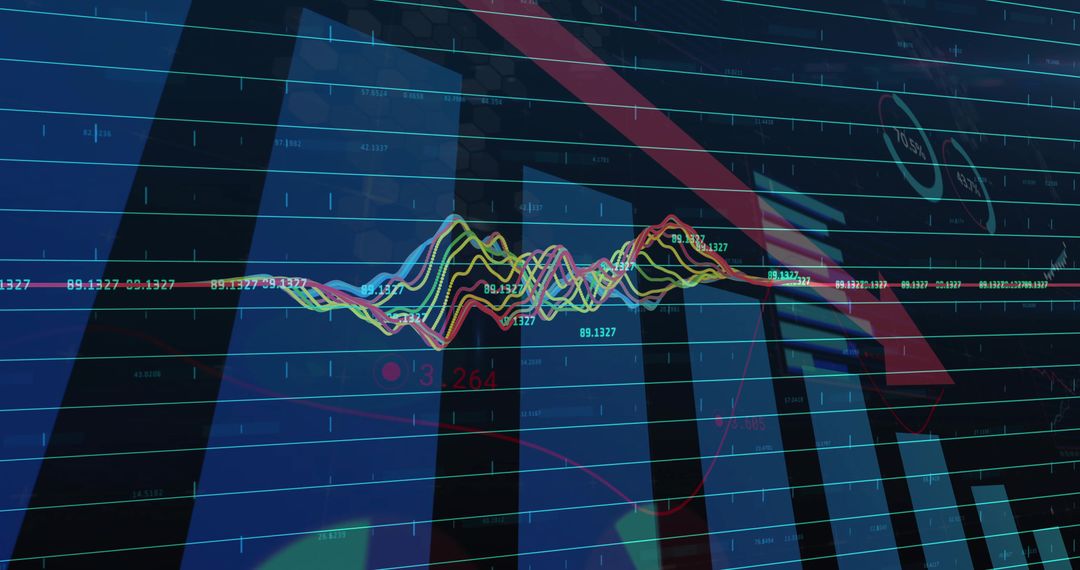
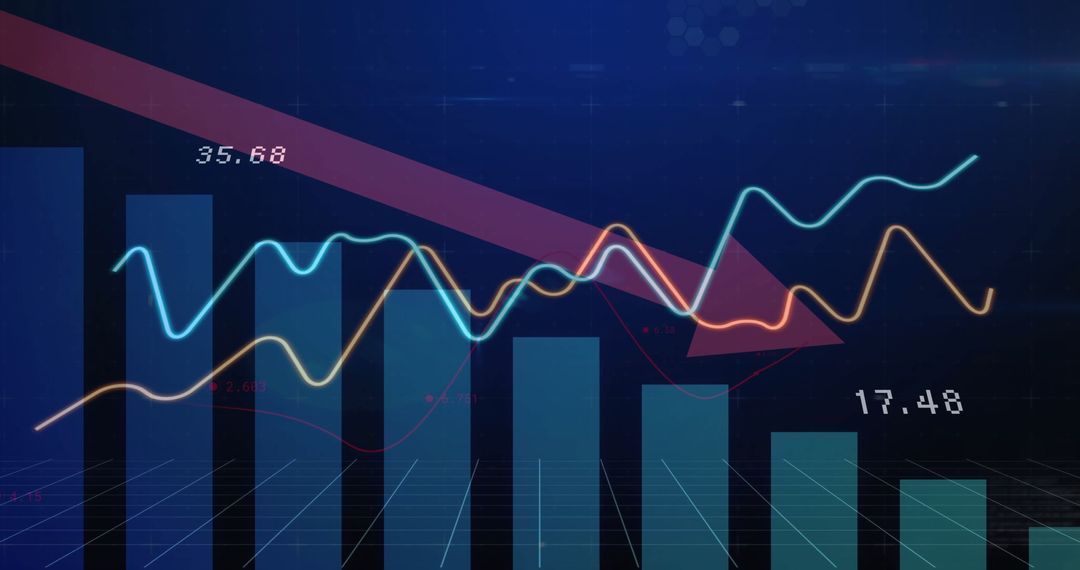
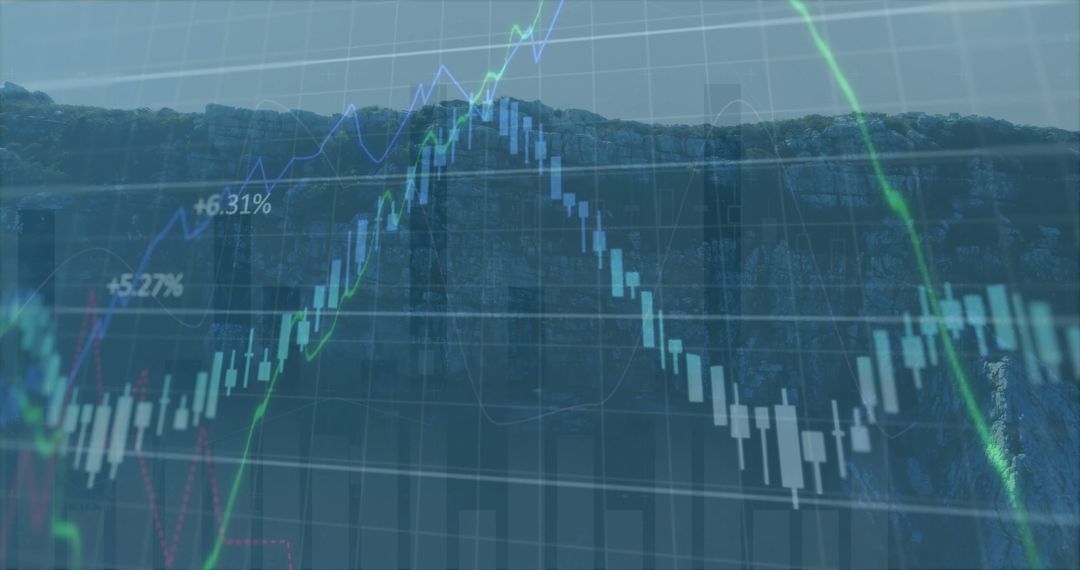
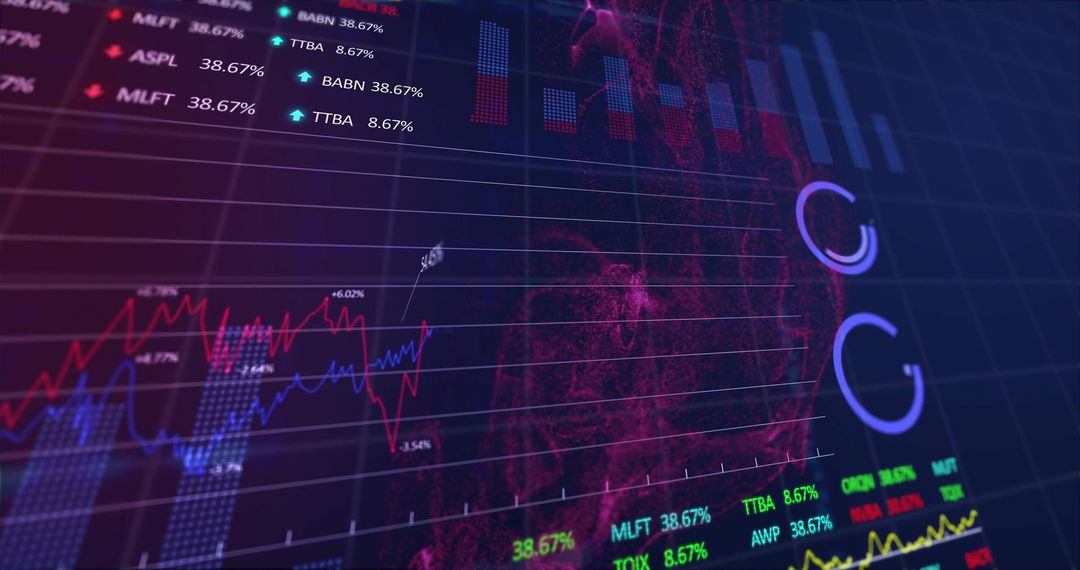
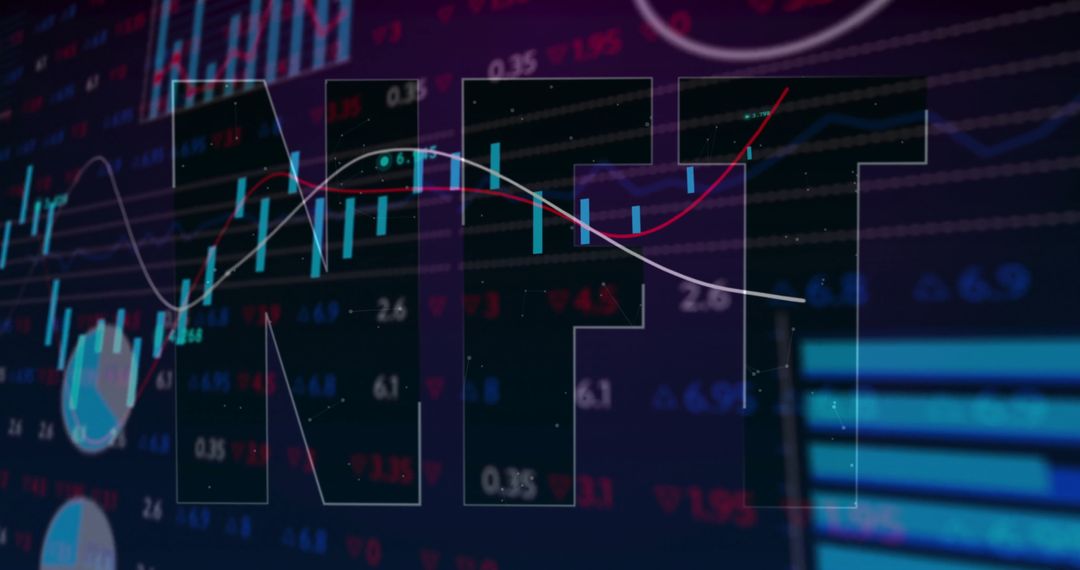
- Mixed Graphics of Financial Analysis with Rising Arrow on Digital Screen
Mixed Graphics of Financial Analysis with Rising Arrow on Digital Screen Image
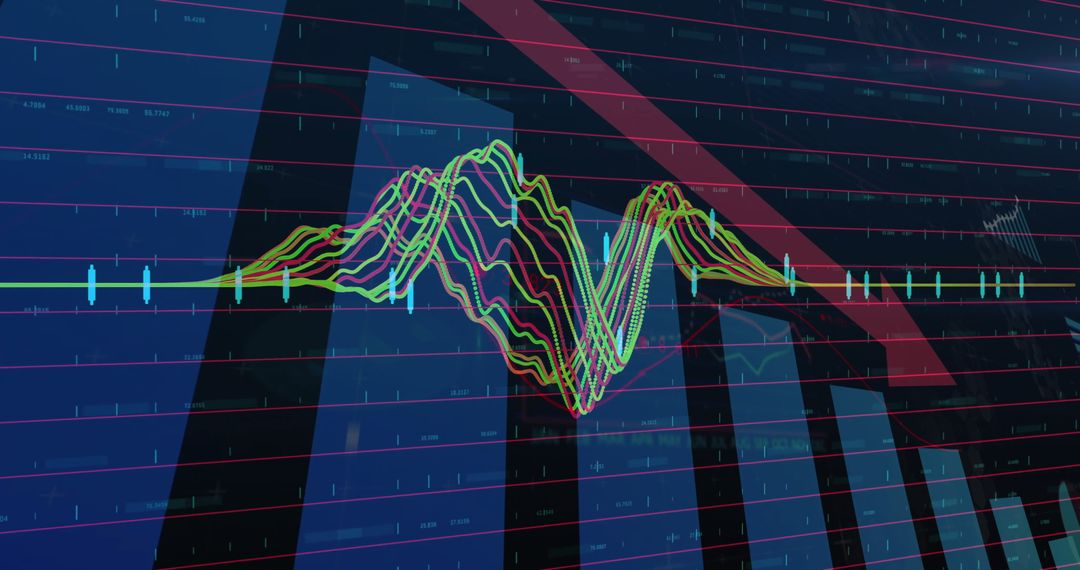
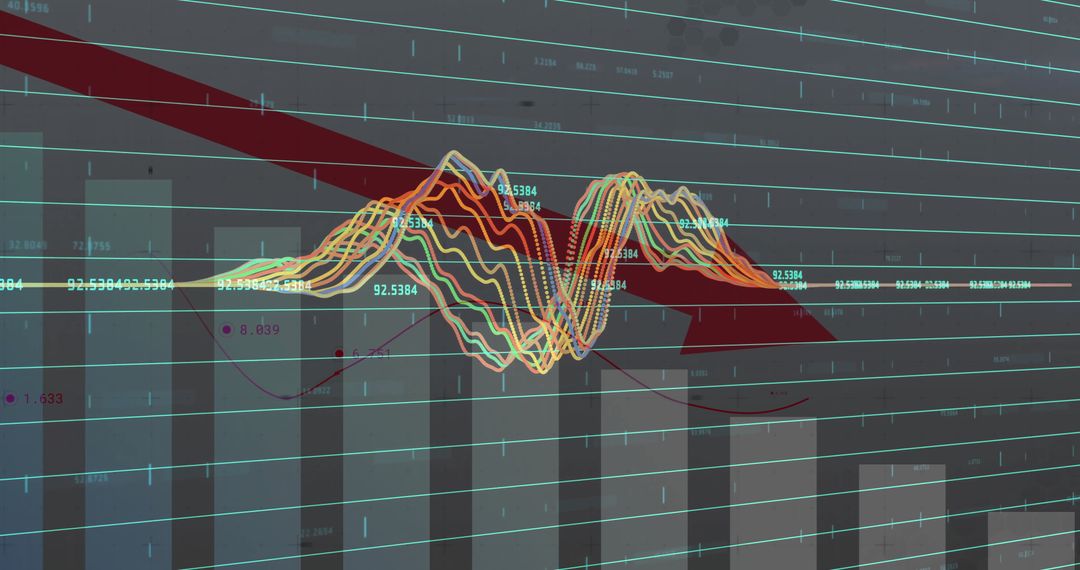
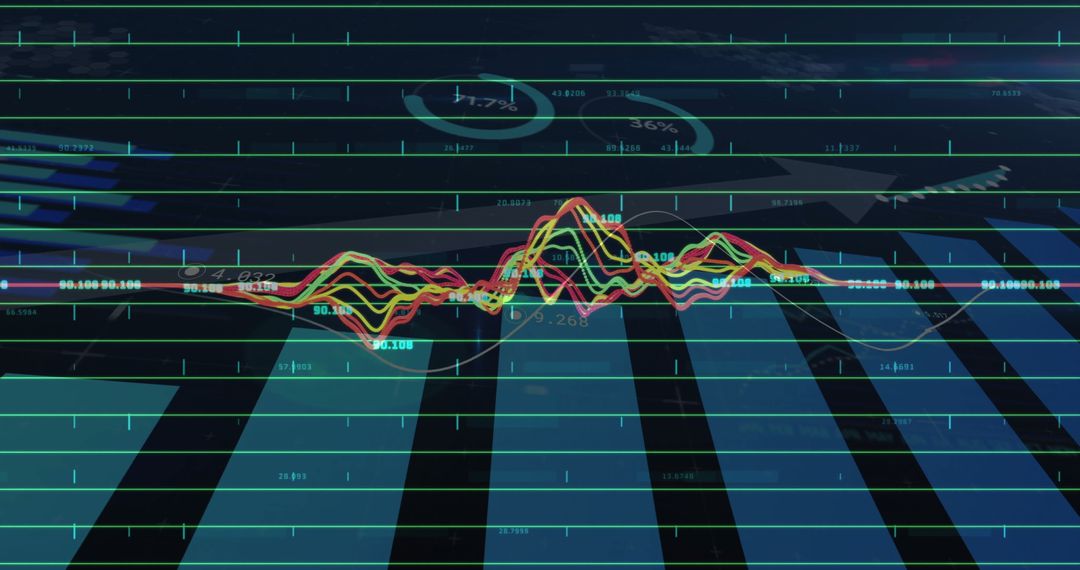
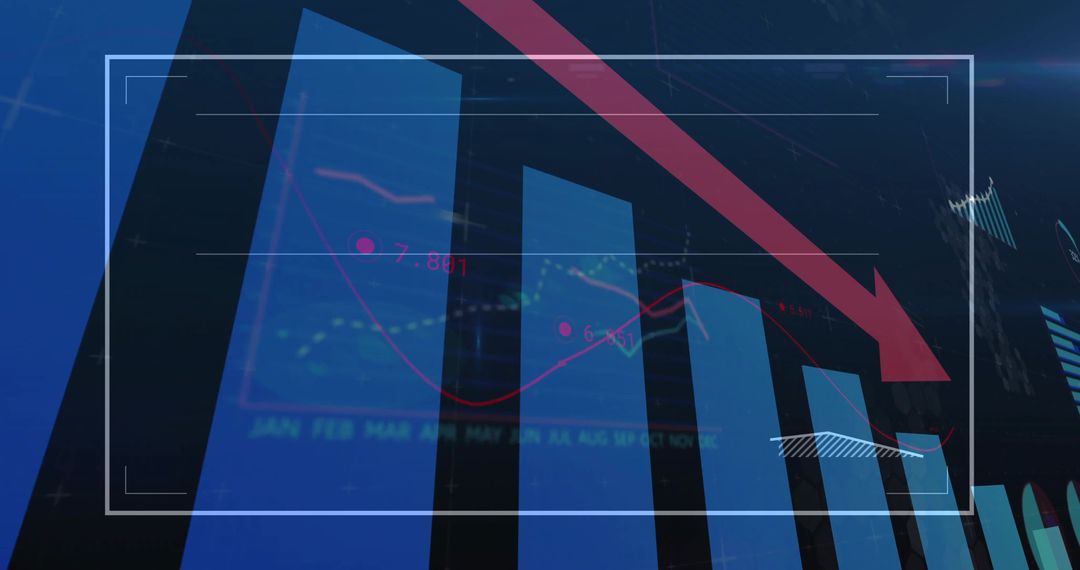
Features a dynamic combination of line graphs and numeric labels on a digital screen, with a prominent red arrow indicating financial growth. This visual is ideal for presentations on business trends, financial forecasts, and corporate analytics. Enhances content related to technology-forward solutions in data analysis and displays key financial indicators with clarity.
Powered by 


0
downloads
downloads
Tags:
More
Credit Photo
If you would like to credit the Photo, here are some ways you can do so
Text Link
photo Link
<span class="text-link">
<span>
<a target="_blank" href=https://pikwizard.com/photo/mixed-graphics-of-financial-analysis-with-rising-arrow-on-digital-screen/07e6fb268574b8c098a84b606d6822d3/>PikWizard</a>
</span>
</span>
<span class="image-link">
<span
style="margin: 0 0 20px 0; display: inline-block; vertical-align: middle; width: 100%;"
>
<a
target="_blank"
href="https://pikwizard.com/photo/mixed-graphics-of-financial-analysis-with-rising-arrow-on-digital-screen/07e6fb268574b8c098a84b606d6822d3/"
style="text-decoration: none; font-size: 10px; margin: 0;"
>
<img src="https://pikwizard.com/pw/medium/07e6fb268574b8c098a84b606d6822d3.jpg" style="margin: 0; width: 100%;" alt="" />
<p style="font-size: 12px; margin: 0;">PikWizard</p>
</a>
</span>
</span>
Free (free of charge)
Free for personal and commercial use.
Author: People Creations
Similar Free Stock Images

Premium


Premium


Premium


Premium


Premium


Premium


Premium


Premium


Premium


Premium


Premium


Premium


Premium


Premium


Premium


Premium


Premium


Premium


Premium


Premium


Premium


Premium


Premium


Premium