
- Home >
- Stock Photos >
- Modern 3D Line Chart with Candlestick Overlay for Data Visualization
Modern 3D Line Chart with Candlestick Overlay for Data Visualization Image
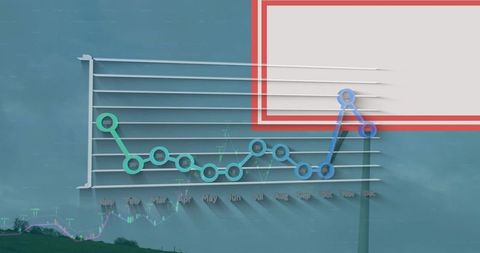
Digital 3D line chart featuring monthly markers and candlestick overlay, ideal for showcasing financial data and analytics. The addition of a red signboard allows for customizable messaging. Useful for presentations related to technology trends, marketing strategies, or financial forecasting tools.

downloads
Tags:
More
Credit Photo
If you would like to credit the Photo, here are some ways you can do so
Text Link
photo Link
<span class="text-link">
<span>
<a target="_blank" href=https://pikwizard.com/photo/modern-3d-line-chart-with-candlestick-overlay-for-data-visualization/7181d763e3225ad9ddb6b197172a948e/>PikWizard</a>
</span>
</span>
<span class="image-link">
<span
style="margin: 0 0 20px 0; display: inline-block; vertical-align: middle; width: 100%;"
>
<a
target="_blank"
href="https://pikwizard.com/photo/modern-3d-line-chart-with-candlestick-overlay-for-data-visualization/7181d763e3225ad9ddb6b197172a948e/"
style="text-decoration: none; font-size: 10px; margin: 0;"
>
<img src="https://pikwizard.com/pw/medium/7181d763e3225ad9ddb6b197172a948e.jpg" style="margin: 0; width: 100%;" alt="" />
<p style="font-size: 12px; margin: 0;">PikWizard</p>
</a>
</span>
</span>
Free (free of charge)
Free for personal and commercial use.
Author: Awesome Content