
- Home >
- Stock Photos >
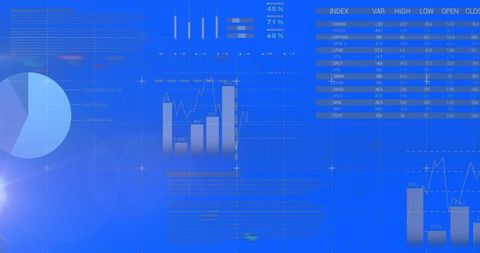
- Modern Data Analytics Dashboard Concept with Pie Chart and Bar Graph
Modern Data Analytics Dashboard Concept with Pie Chart and Bar Graph Image

Teal digital interface features pie chart and 3D bar graph, making it ideal for presentations or educational material on data analytics and technology integration. Useful for illustrating business processes, data analysis techniques, or modern tech insights. Ideal for online courses or apps focused on data visualization.
Powered by 


downloads
Tags:
More
Credit Photo
If you would like to credit the Photo, here are some ways you can do so
Text Link
photo Link
<span class="text-link">
<span>
<a target="_blank" href=https://pikwizard.com/photo/modern-data-analytics-dashboard-concept-with-pie-chart-and-bar-graph/0c8fcdfd0c325df8baf0888a642abb60/>PikWizard</a>
</span>
</span>
<span class="image-link">
<span
style="margin: 0 0 20px 0; display: inline-block; vertical-align: middle; width: 100%;"
>
<a
target="_blank"
href="https://pikwizard.com/photo/modern-data-analytics-dashboard-concept-with-pie-chart-and-bar-graph/0c8fcdfd0c325df8baf0888a642abb60/"
style="text-decoration: none; font-size: 10px; margin: 0;"
>
<img src="https://pikwizard.com/pw/medium/0c8fcdfd0c325df8baf0888a642abb60.jpg" style="margin: 0; width: 100%;" alt="" />
<p style="font-size: 12px; margin: 0;">PikWizard</p>
</a>
</span>
</span>
Free (free of charge)
Free for personal and commercial use.
Author: Awesome Content
Similar Free Stock Images

Premium


Premium


Premium

Premium


Premium


Premium


Premium


Premium

Premium


Premium

Premium

Premium


Premium


Premium


Premium


Premium


Premium


Premium


Premium


Premium
Premium


Premium


Premium


Premium


Premium


Explore More Free Stock Images