- Home >
- Stock Photos >
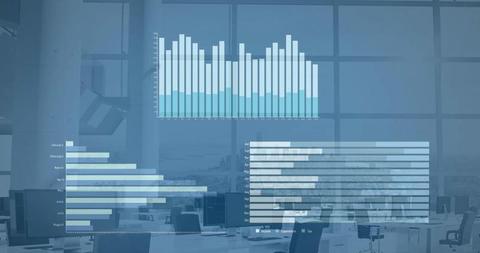
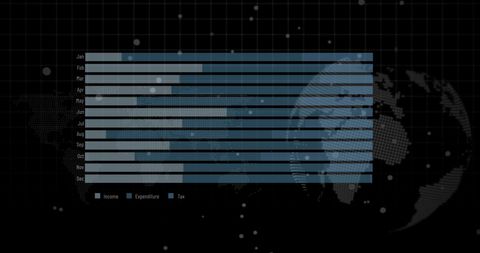
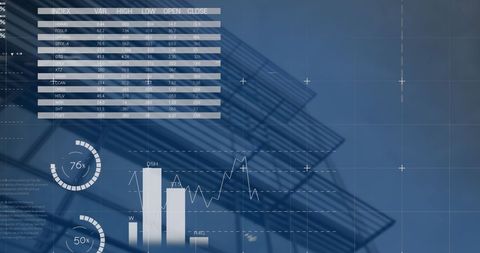
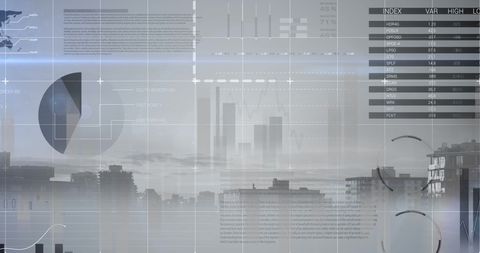
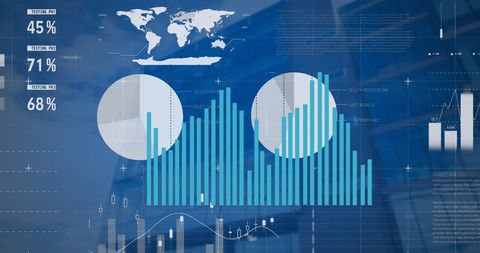
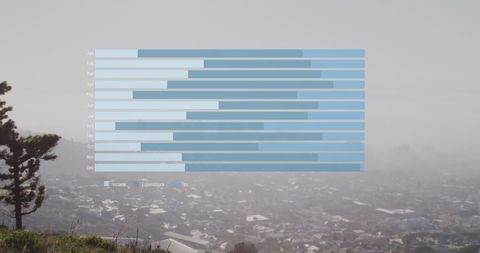
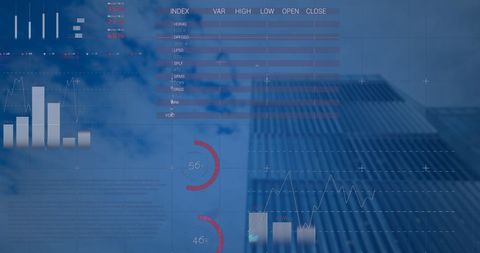
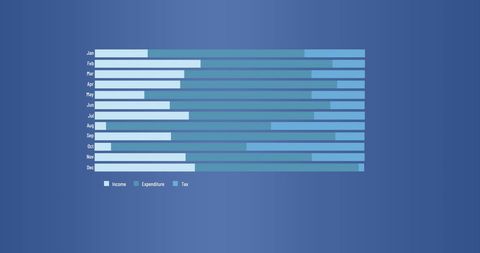
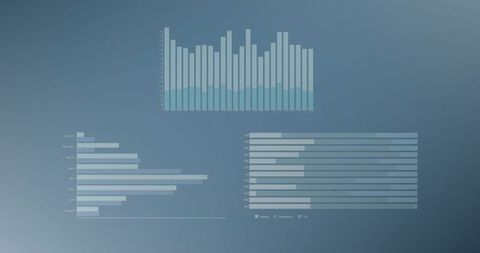
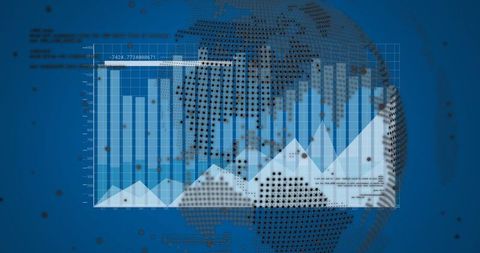
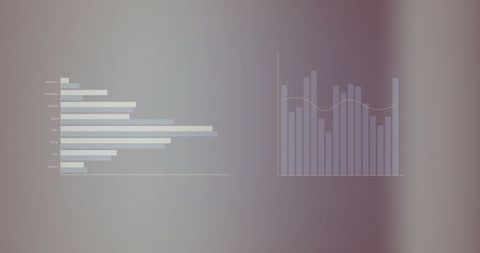
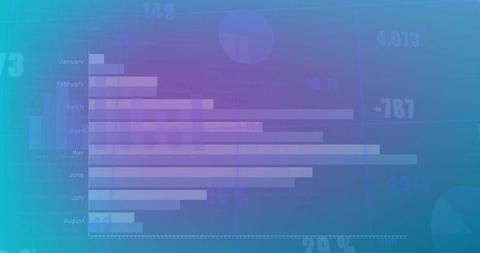
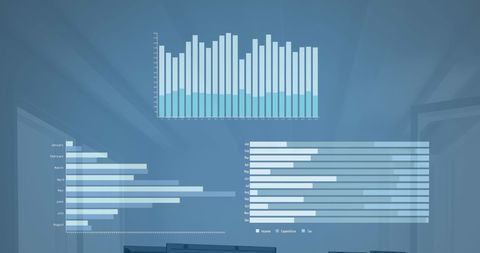
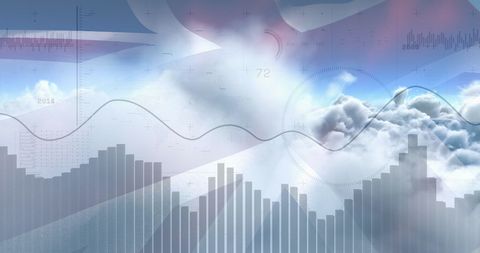
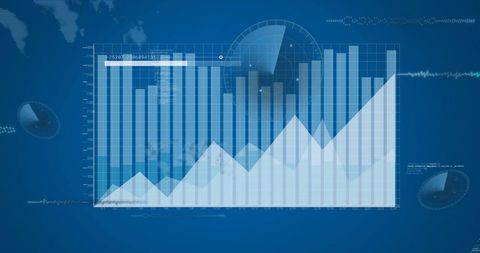
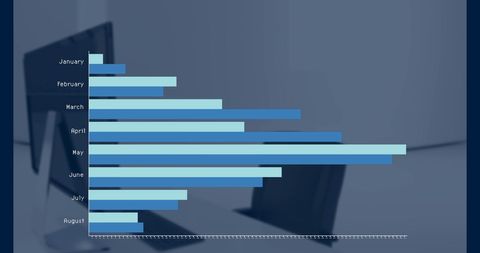
- Modern Data Visualization with Bar Charts on Blue Background
Modern Data Visualization with Bar Charts on Blue Background Image
Image depicts contrasting bar charts on blue background, representing financial data and trends. Useful for illustrating financial reports, economic presentations, and business analytics discussions. Perfect for use in websites, tutorials, and articles focusing on data representation in financial sectors.

downloads
Tags:
More
Credit Photo
If you would like to credit the Photo, here are some ways you can do so
Text Link
photo Link
<span class="text-link">
<span>
<a target="_blank" href=https://pikwizard.com/photo/modern-data-visualization-with-bar-charts-on-blue-background/64590cc2fe808d837db3ae1699e076ea/>PikWizard</a>
</span>
</span>
<span class="image-link">
<span
style="margin: 0 0 20px 0; display: inline-block; vertical-align: middle; width: 100%;"
>
<a
target="_blank"
href="https://pikwizard.com/photo/modern-data-visualization-with-bar-charts-on-blue-background/64590cc2fe808d837db3ae1699e076ea/"
style="text-decoration: none; font-size: 10px; margin: 0;"
>
<img src="https://pikwizard.com/pw/medium/64590cc2fe808d837db3ae1699e076ea.jpg" style="margin: 0; width: 100%;" alt="" />
<p style="font-size: 12px; margin: 0;">PikWizard</p>
</a>
</span>
</span>
Free (free of charge)
Free for personal and commercial use.
Author: Creative Art