- Home >
- Stock Photos >
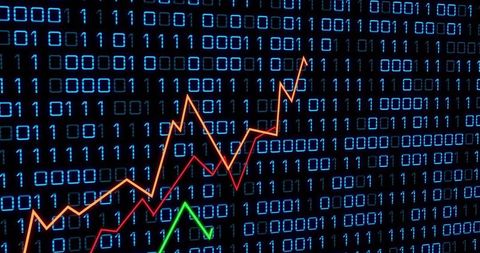
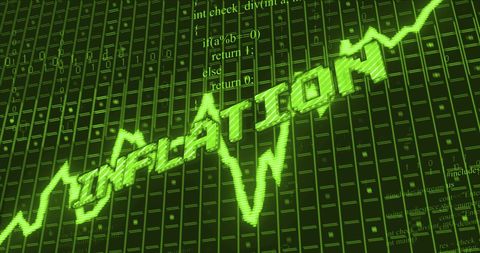
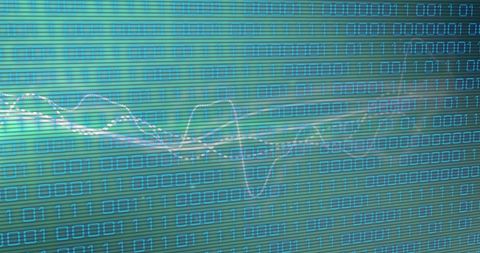
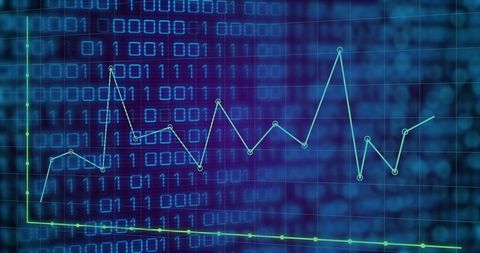
- Modern Data Visualization with Binary Matrix and Analytics Graph
Modern Data Visualization with Binary Matrix and Analytics Graph Image
Orange zigzag chart over binary digits suggests a blend of data and analytics in technology and finance. Useful for projects related to data science, information technology, digital finance, or presentations on software development. This depiction can be used in brochures, websites, or presentations that discuss trends in data analytics and industry disruptions.

downloads
Tags:
More
Credit Photo
If you would like to credit the Photo, here are some ways you can do so
Text Link
photo Link
<span class="text-link">
<span>
<a target="_blank" href=https://pikwizard.com/photo/modern-data-visualization-with-binary-matrix-and-analytics-graph/e4e5bf9c58770096fbf470193458d93b/>PikWizard</a>
</span>
</span>
<span class="image-link">
<span
style="margin: 0 0 20px 0; display: inline-block; vertical-align: middle; width: 100%;"
>
<a
target="_blank"
href="https://pikwizard.com/photo/modern-data-visualization-with-binary-matrix-and-analytics-graph/e4e5bf9c58770096fbf470193458d93b/"
style="text-decoration: none; font-size: 10px; margin: 0;"
>
<img src="https://pikwizard.com/pw/medium/e4e5bf9c58770096fbf470193458d93b.jpg" style="margin: 0; width: 100%;" alt="" />
<p style="font-size: 12px; margin: 0;">PikWizard</p>
</a>
</span>
</span>
Free (free of charge)
Free for personal and commercial use.
Author: People Creations