- Home >
- Stock Photos >
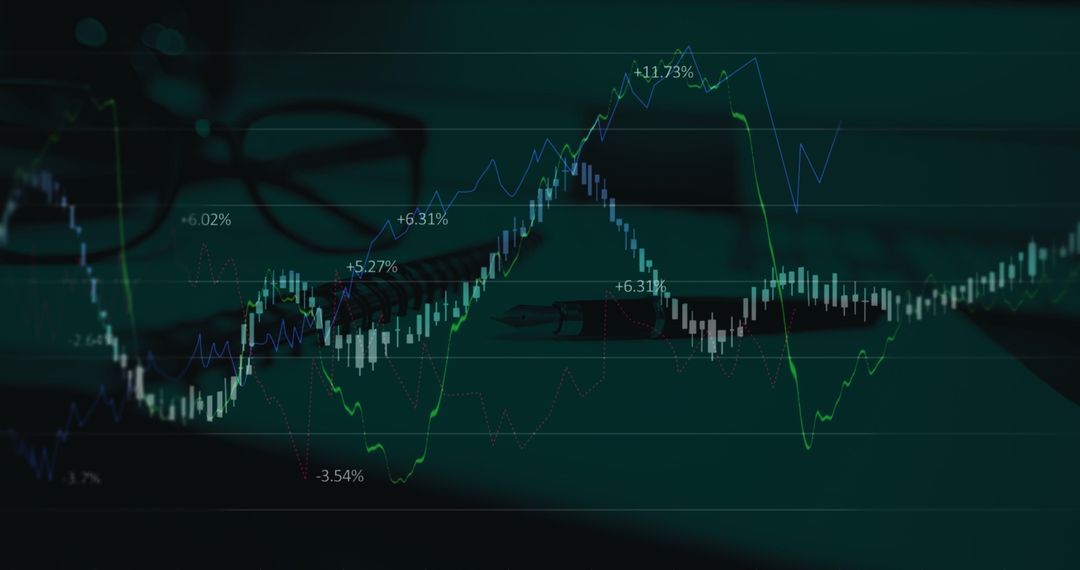
- Modern Data Visualization with Neon Line and Red Histogram on 3D Grid
Modern Data Visualization with Neon Line and Red Histogram on 3D Grid Image

This visualization integrates modern analytical tools by presenting a neon cyan line graph alongside a vibrant red histogram over a 3D grid background, making it perfect for presentations emphasizing data analysis, technology innovation, or futuristic digital trends. This image can also enhance websites, presentations, or social media content focusing on advanced visual analytics methodologies.
Powered by 


0
downloads
downloads
Tags:
More
Credit Photo
If you would like to credit the Photo, here are some ways you can do so
Text Link
photo Link
<span class="text-link">
<span>
<a target="_blank" href=https://pikwizard.com/photo/modern-data-visualization-with-neon-line-and-red-histogram-on-3d-grid/ecab2f2e7afa358d3b69211f37cc11fd/>PikWizard</a>
</span>
</span>
<span class="image-link">
<span
style="margin: 0 0 20px 0; display: inline-block; vertical-align: middle; width: 100%;"
>
<a
target="_blank"
href="https://pikwizard.com/photo/modern-data-visualization-with-neon-line-and-red-histogram-on-3d-grid/ecab2f2e7afa358d3b69211f37cc11fd/"
style="text-decoration: none; font-size: 10px; margin: 0;"
>
<img src="https://pikwizard.com/pw/medium/ecab2f2e7afa358d3b69211f37cc11fd.jpg" style="margin: 0; width: 100%;" alt="" />
<p style="font-size: 12px; margin: 0;">PikWizard</p>
</a>
</span>
</span>
Free (free of charge)
Free for personal and commercial use.
Author: Awesome Content
Similar Free Stock Images
Premium


Premium


Premium


Premium


Premium


Premium


Premium


Premium


Premium


Premium


Premium


Premium


Premium


Premium


Premium


Premium


Premium


Premium


Premium


Premium


Premium


Premium


Premium


Premium