
- Home >
- Stock Photos >
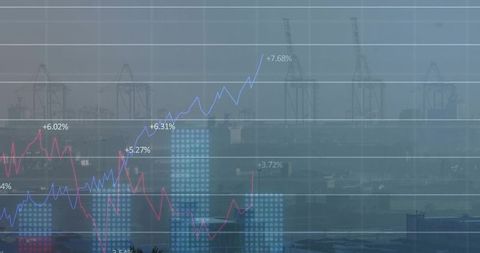
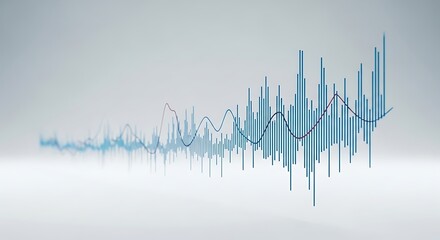
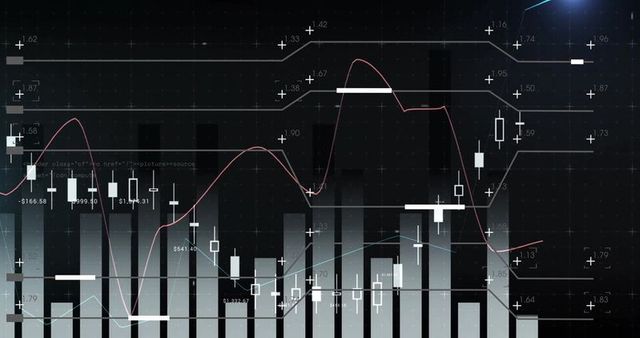
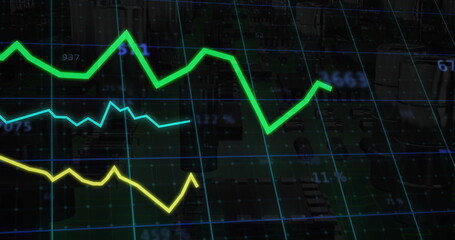
- Modern Digital Financial Chart Interface with Fluctuating Graphs
Modern Digital Financial Chart Interface with Fluctuating Graphs Image

Visualizing digital financial services through hyper-detailed graph interface showcasing fluctuating data trends. Conceptual image well-suited for websites related investments or market prediction tools, technology advancements levels digital anaytics expertise trade postings.
Powered by 


downloads
Tags:
More
Credit Photo
If you would like to credit the Photo, here are some ways you can do so
Text Link
photo Link
<span class="text-link">
<span>
<a target="_blank" href=https://pikwizard.com/photo/modern-digital-financial-chart-interface-with-fluctuating-graphs/fbd6283f23f48dc9aa055d80410db71f/>PikWizard</a>
</span>
</span>
<span class="image-link">
<span
style="margin: 0 0 20px 0; display: inline-block; vertical-align: middle; width: 100%;"
>
<a
target="_blank"
href="https://pikwizard.com/photo/modern-digital-financial-chart-interface-with-fluctuating-graphs/fbd6283f23f48dc9aa055d80410db71f/"
style="text-decoration: none; font-size: 10px; margin: 0;"
>
<img src="https://pikwizard.com/pw/medium/fbd6283f23f48dc9aa055d80410db71f.jpg" style="margin: 0; width: 100%;" alt="" />
<p style="font-size: 12px; margin: 0;">PikWizard</p>
</a>
</span>
</span>
Free (free of charge)
Free for personal and commercial use.
Author: People Creations
Similar Free Stock Images
Premium


Premium


Premium


Premium


Premium


Premium


Premium

Premium


Premium


Premium


Premium

Premium


Premium


Premium


Premium


Premium

Premium


Premium


Premium

Premium

Premium


Premium


Premium


Premium


Premium


Explore More Free Stock Images