
- Home >
- Stock Photos >
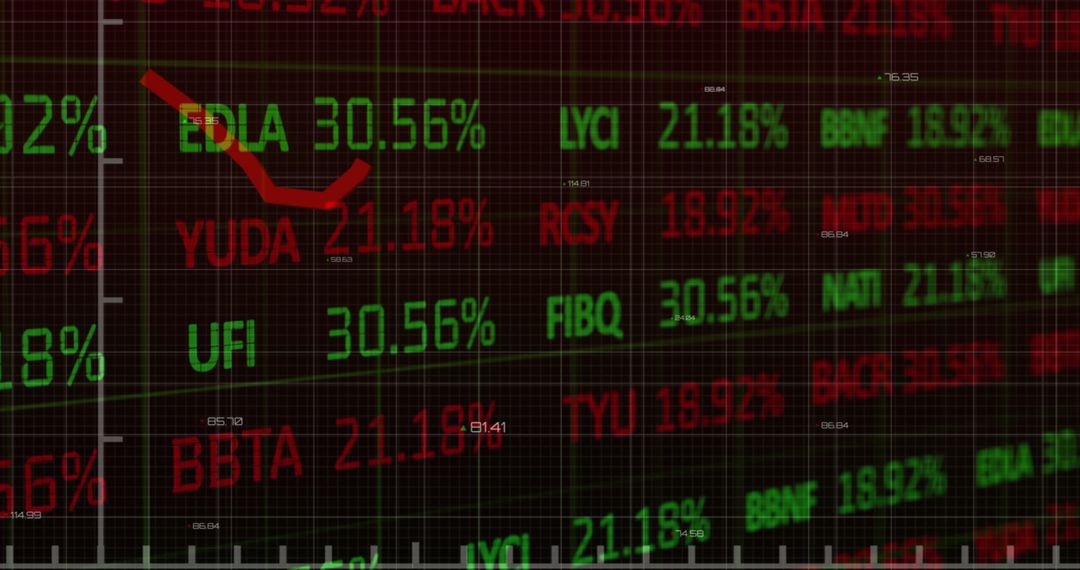
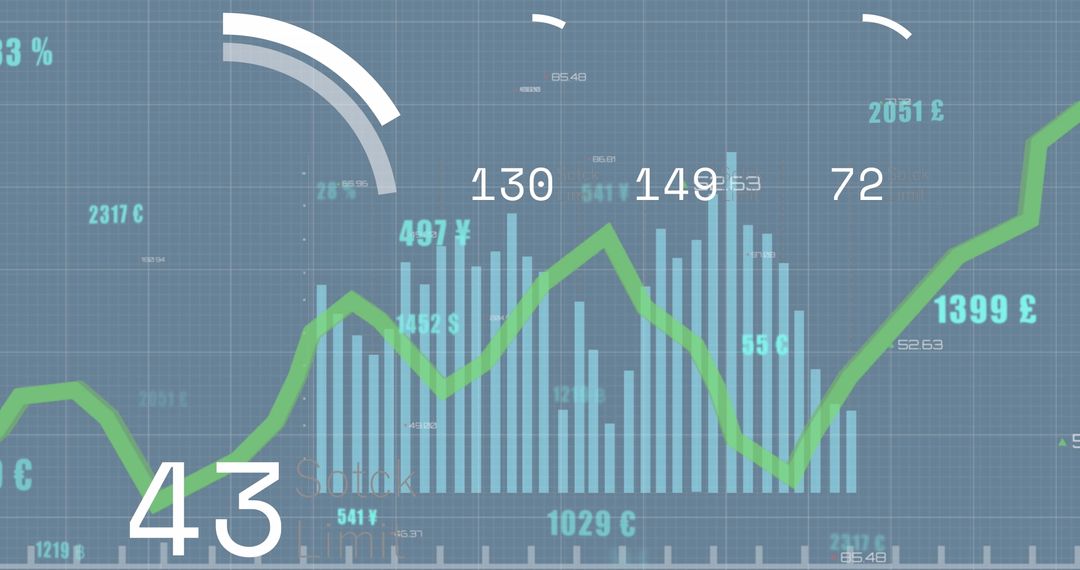
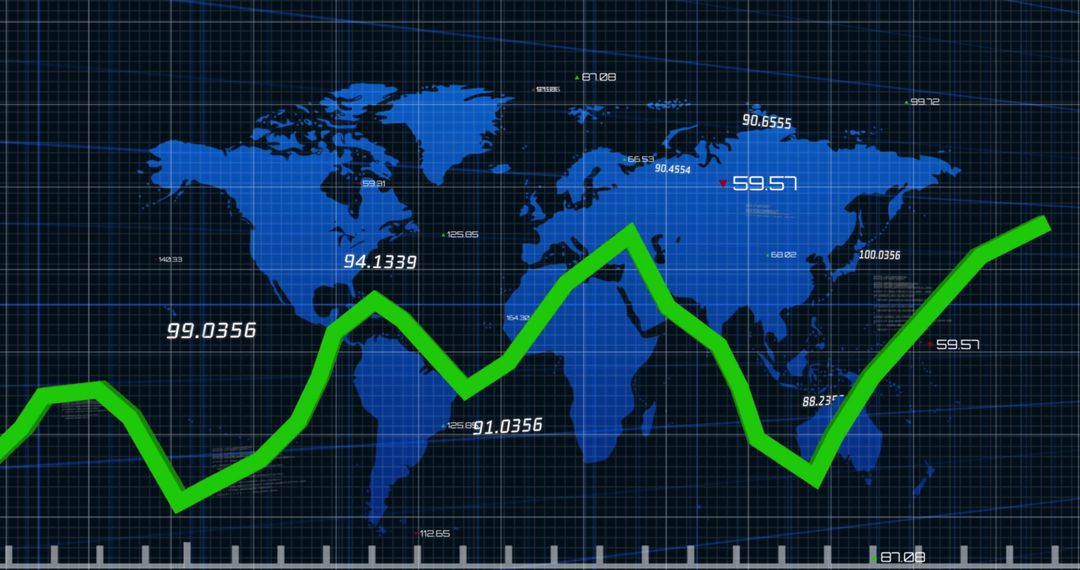
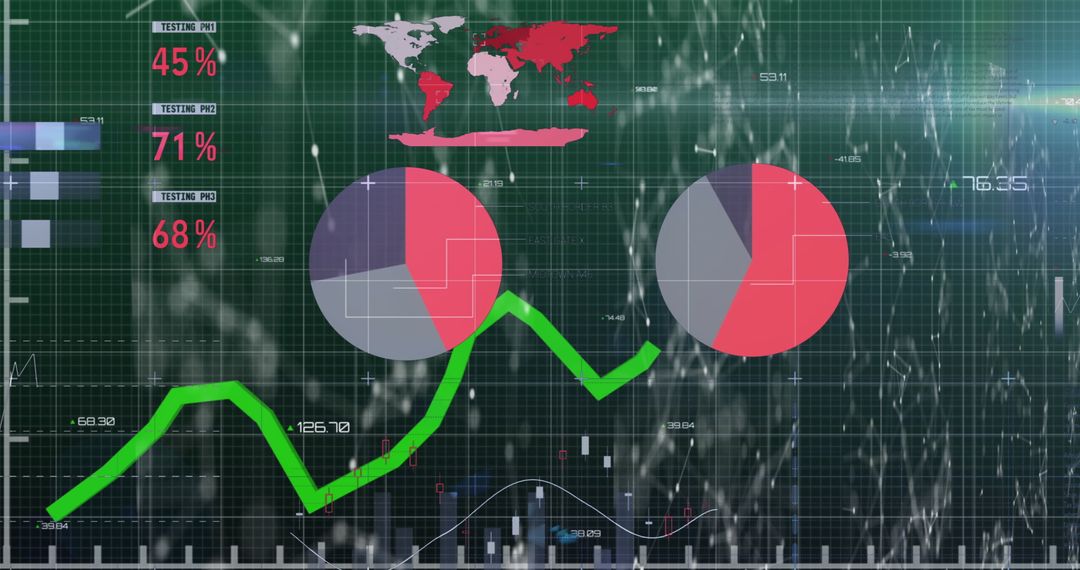
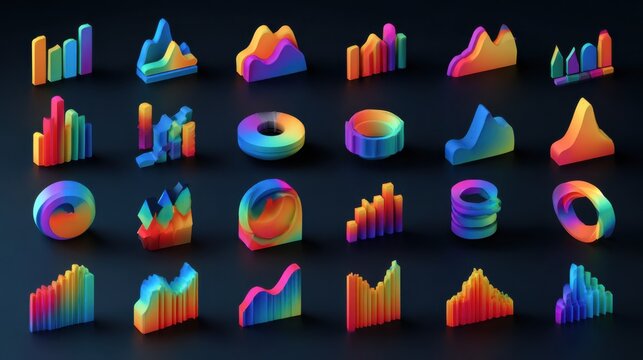
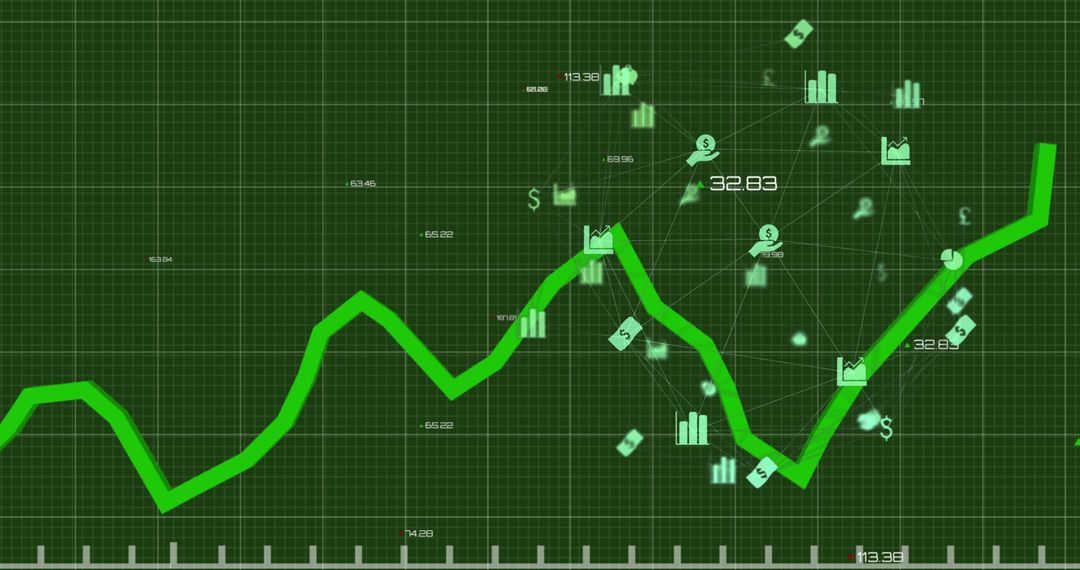
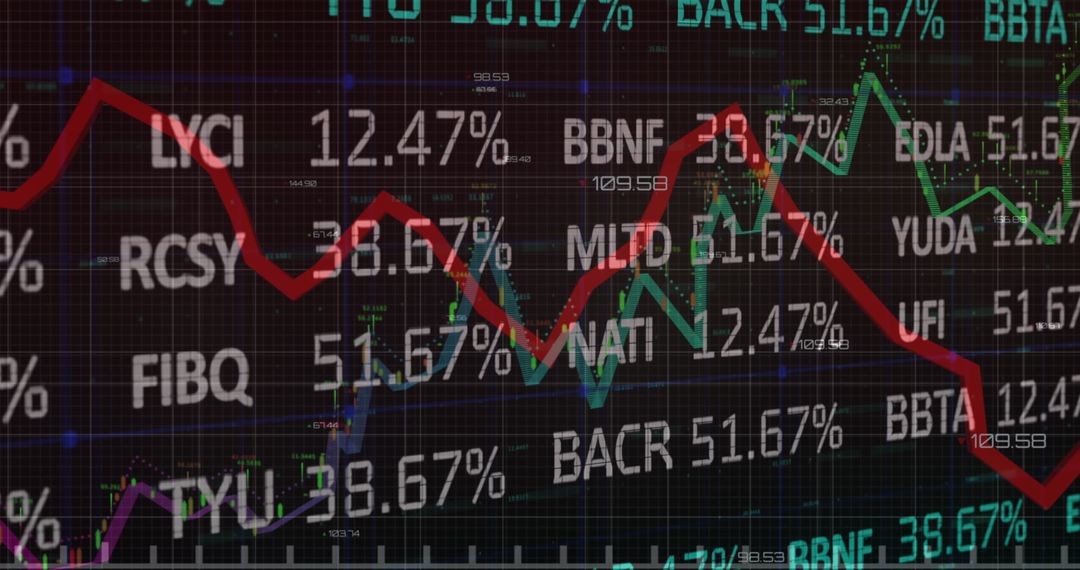
- Modern Finance Simplified with 3D Analytics Illustration Concept
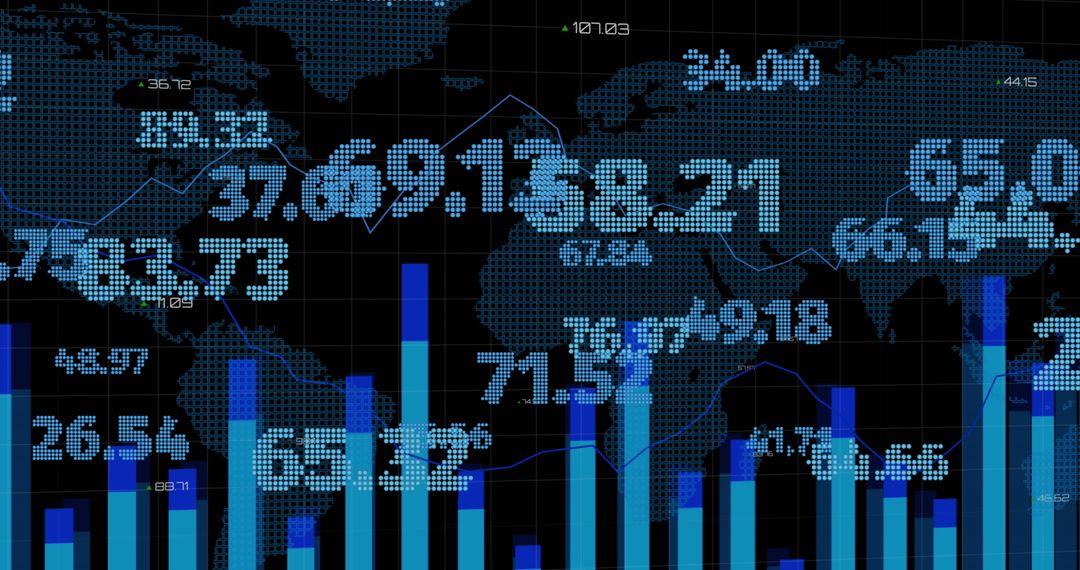
Modern Finance Simplified with 3D Analytics Illustration Concept Image

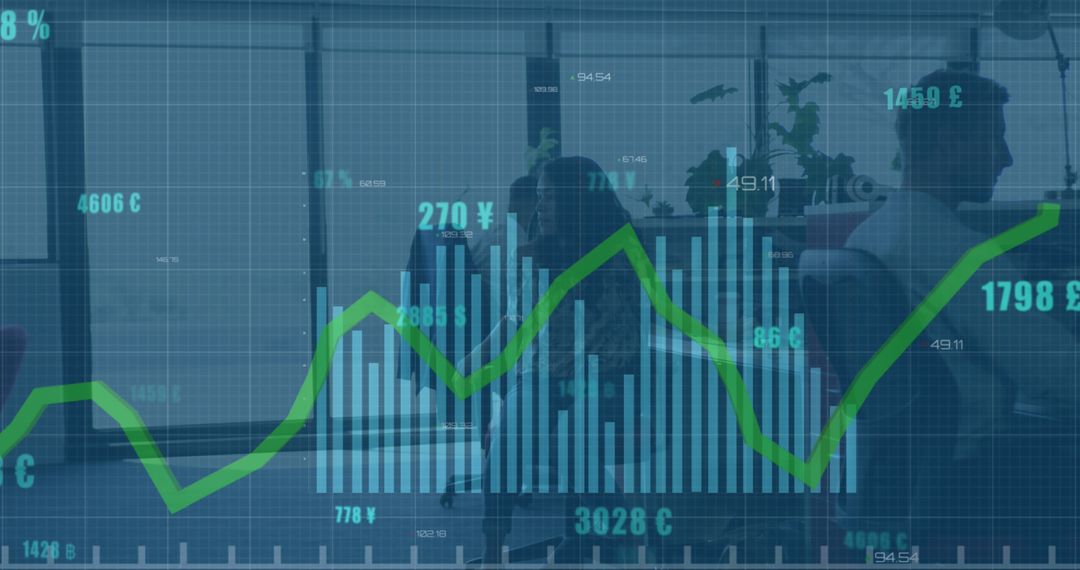
This illustration showcasing financial data interconnected with vibrant magenta bars and a 3D backdrop provides an engaging visualization of market trends. Enhanced with stock tickers and a map overlay, it presents both technological and commercial depth, making it ideal for use in blog posts, reports, articles, and presentations focusing on finance, trading strategies, or advancements in data analysis technologies. The interactive depiction connects well with audiences seeking detailed insights into modern financial landscapes.
Powered by 


2
downloads
downloads
Tags:
More
Credit Photo
If you would like to credit the Photo, here are some ways you can do so
Text Link
photo Link
<span class="text-link">
<span>
<a target="_blank" href=https://pikwizard.com/photo/modern-finance-simplified-with-3d-analytics-illustration-concept/847fbb51c45cbeed63d22e6d16980505/>PikWizard</a>
</span>
</span>
<span class="image-link">
<span
style="margin: 0 0 20px 0; display: inline-block; vertical-align: middle; width: 100%;"
>
<a
target="_blank"
href="https://pikwizard.com/photo/modern-finance-simplified-with-3d-analytics-illustration-concept/847fbb51c45cbeed63d22e6d16980505/"
style="text-decoration: none; font-size: 10px; margin: 0;"
>
<img src="https://pikwizard.com/pw/medium/847fbb51c45cbeed63d22e6d16980505.jpg" style="margin: 0; width: 100%;" alt="" />
<p style="font-size: 12px; margin: 0;">PikWizard</p>
</a>
</span>
</span>
Free (free of charge)
Free for personal and commercial use.
Author: Awesome Content
Similar Free Stock Images

Premium


Premium


Premium


Premium


Premium


Premium


Premium


Premium


Premium


Premium


Premium


Premium


Premium


Premium


Premium


Premium


Premium


Premium


Premium


Premium


Premium


Premium


Premium


Premium

