- Home >
- Stock Photos >
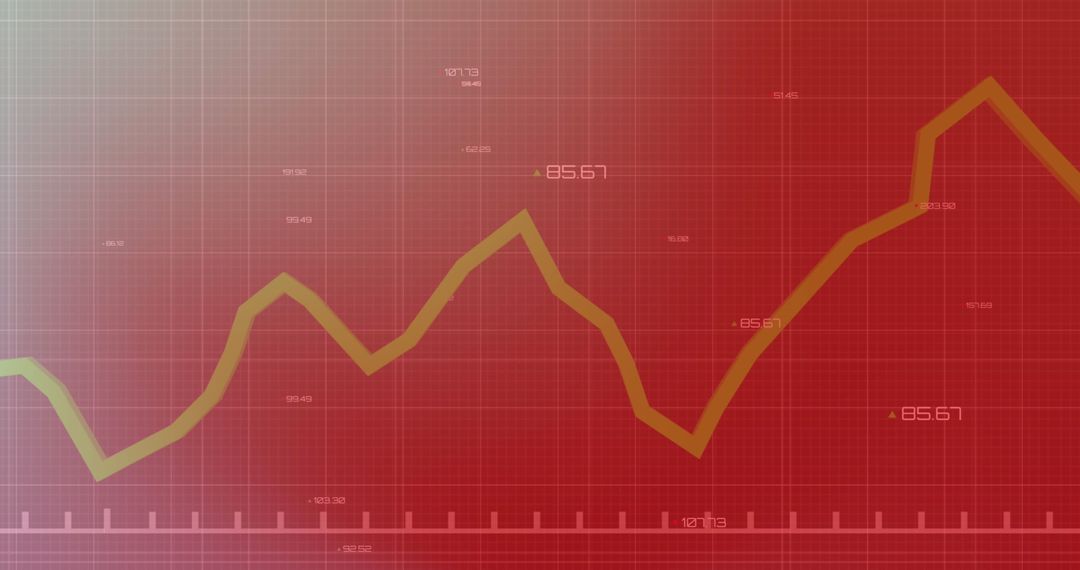
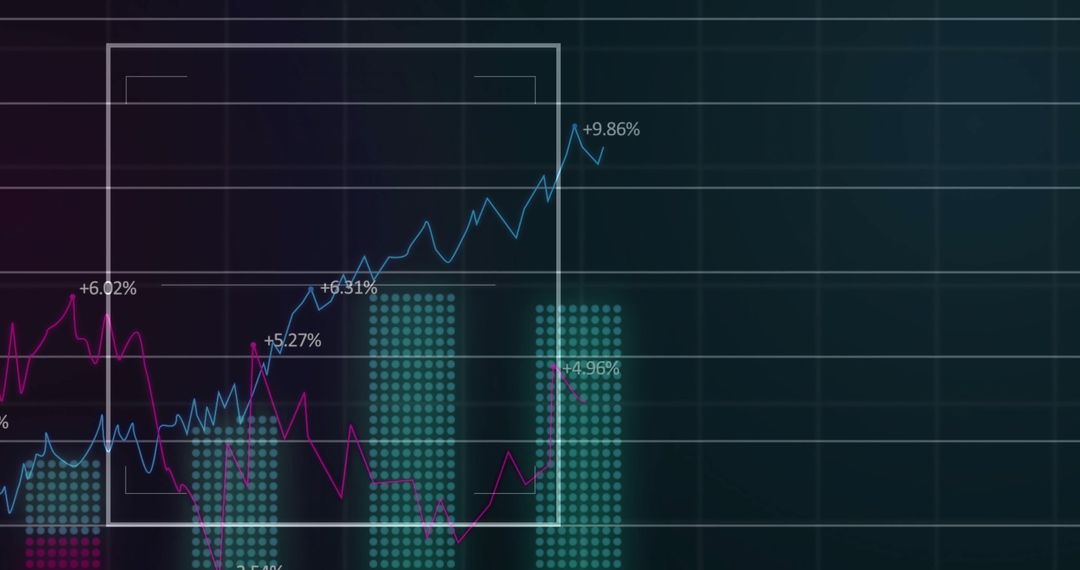
- Modern Financial Analysis Display with Dynamic Bar and Line Graphs
Modern Financial Analysis Display with Dynamic Bar and Line Graphs Image

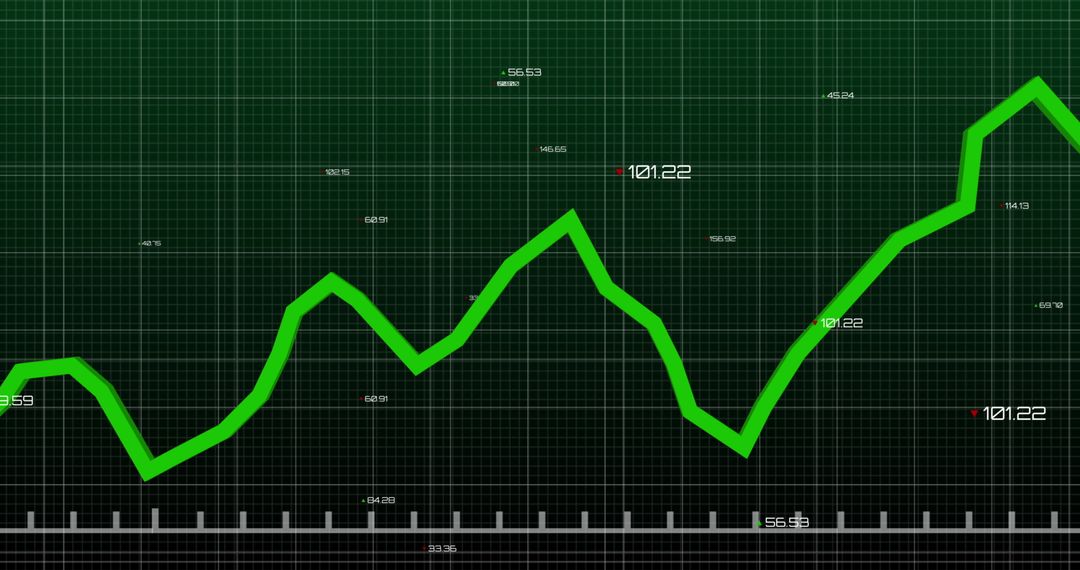
This visual captures a contemporary financial interface illustrating dynamic elements typical in the analysis of stocks or other market-related instruments. It is composed of colorful bars and fluctuating lines with refences to precise timing, indicating advanced algorithms influencing market predictions. Suitable for articles, presentations, or platforms focusing on investment strategies, data analysis, or market monitoring demonstrations.
Powered by  - Get 15% off with code: PIKWIZARD15


0
downloads
downloads
Tags:
More
Credit Photo
If you would like to credit the Photo, here are some ways you can do so
Text Link
photo Link
<span class="text-link">
<span>
<a target="_blank" href=https://pikwizard.com/photo/modern-financial-analysis-display-with-dynamic-bar-and-line-graphs/da282dbcc2cd758bde93a472d9eafe4b/>PikWizard</a>
</span>
</span>
<span class="image-link">
<span
style="margin: 0 0 20px 0; display: inline-block; vertical-align: middle; width: 100%;"
>
<a
target="_blank"
href="https://pikwizard.com/photo/modern-financial-analysis-display-with-dynamic-bar-and-line-graphs/da282dbcc2cd758bde93a472d9eafe4b/"
style="text-decoration: none; font-size: 10px; margin: 0;"
>
<img src="https://pikwizard.com/pw/medium/da282dbcc2cd758bde93a472d9eafe4b.jpg" style="margin: 0; width: 100%;" alt="" />
<p style="font-size: 12px; margin: 0;">PikWizard</p>
</a>
</span>
</span>
Free (free of charge)
Free for personal and commercial use.
Author: Authentic Images
Similar Free Stock Images
Premium


Premium


Premium


Premium


Premium


Premium


Premium


Premium


Premium


Premium


Premium


Premium


Premium


Premium


Premium


Premium


Premium


Premium


Premium


Premium


Premium


Premium


Premium


Premium