- Home >
- Stock Photos >
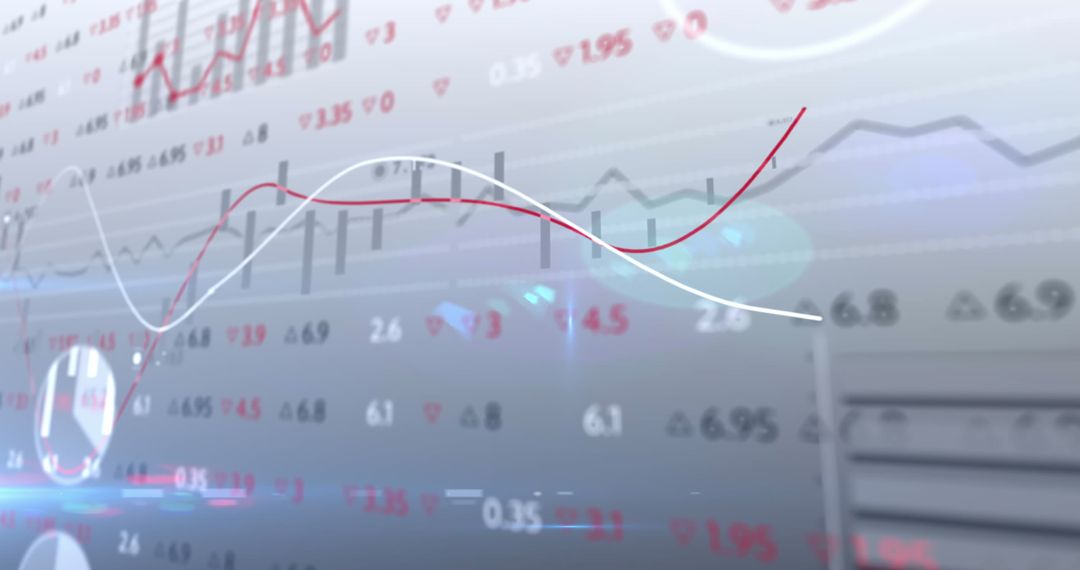
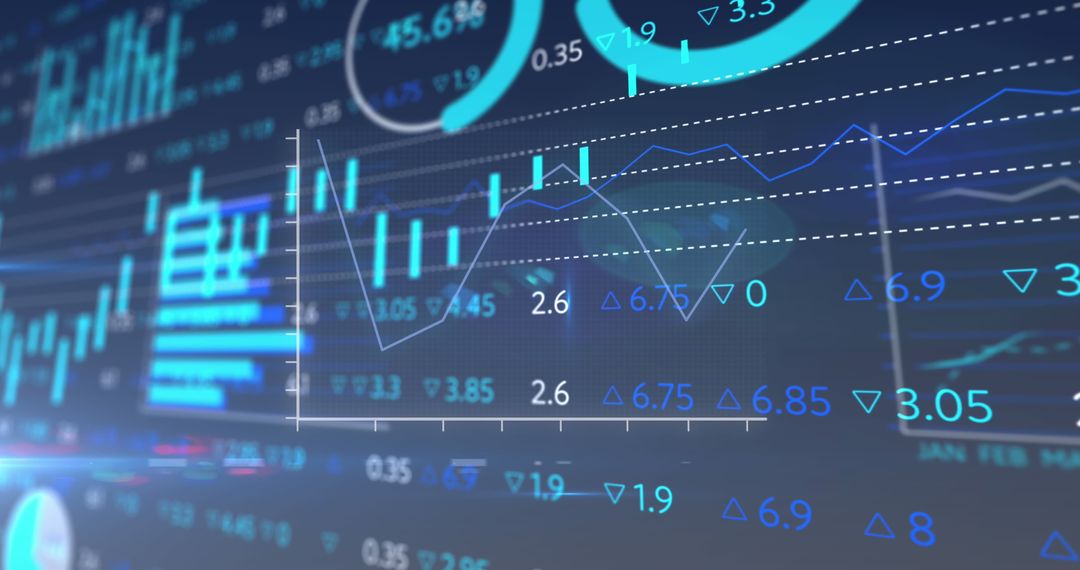
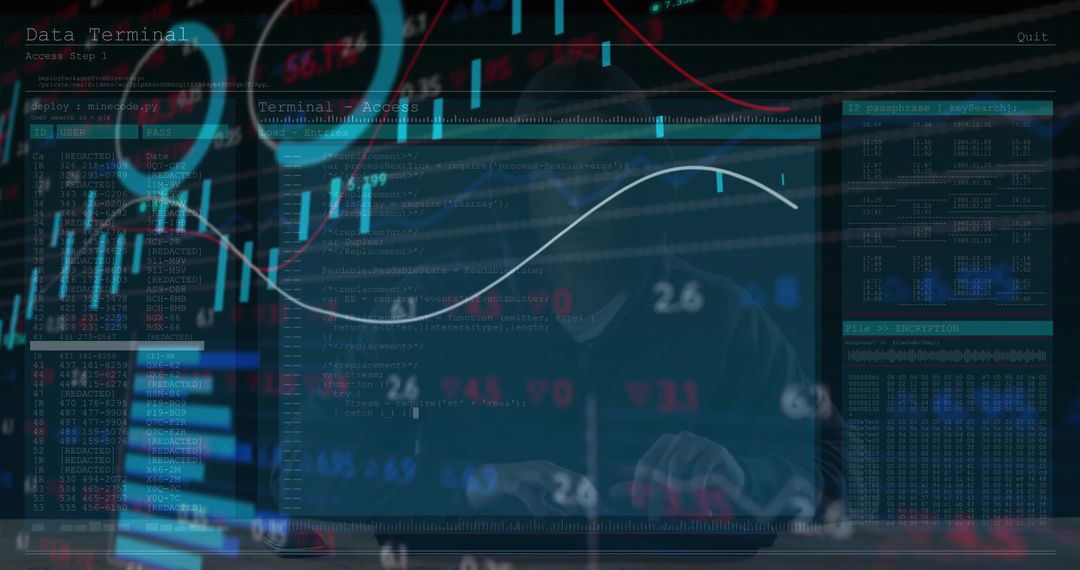
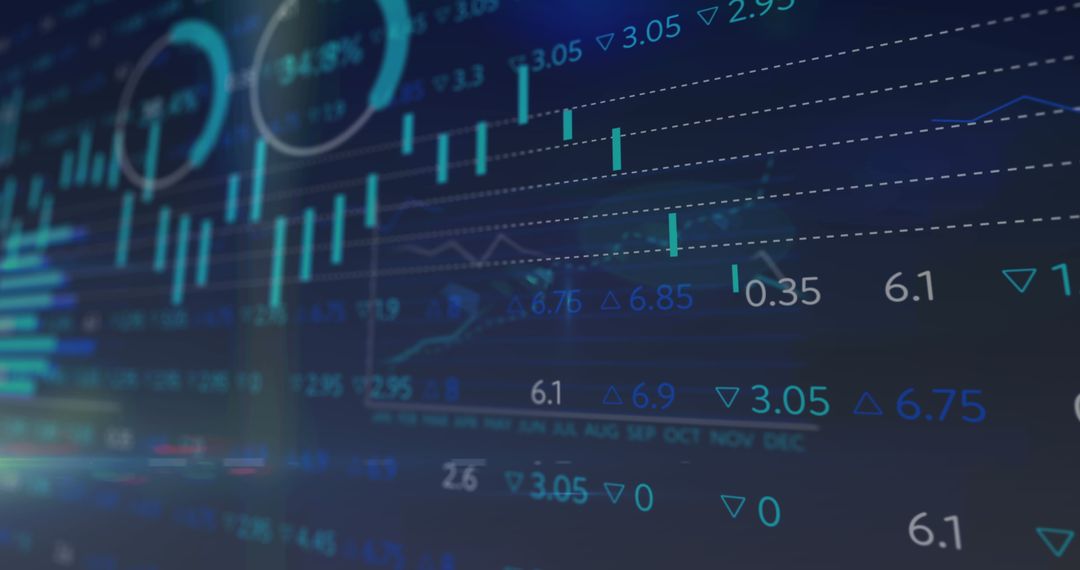
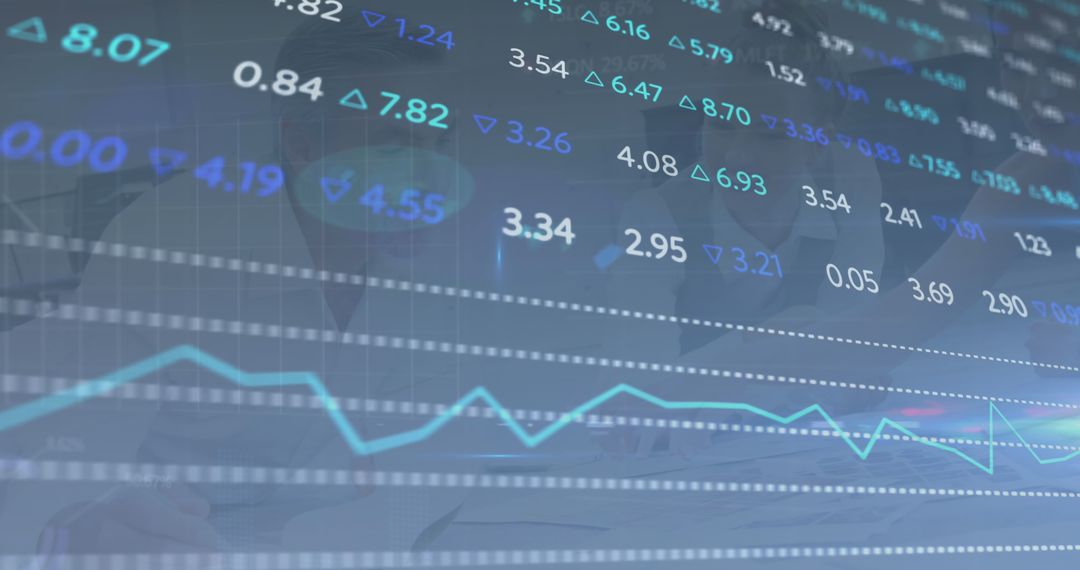
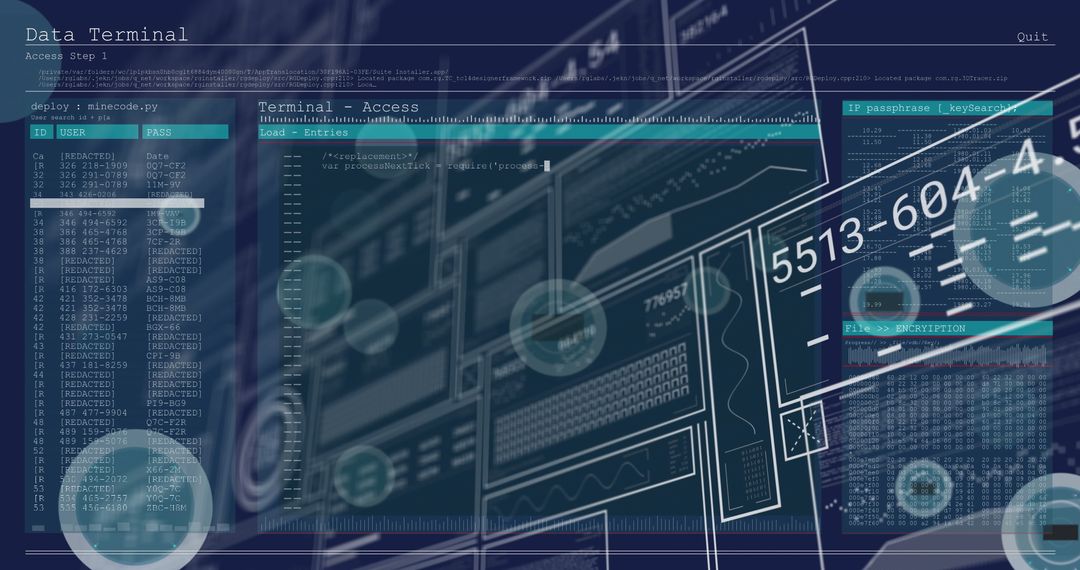
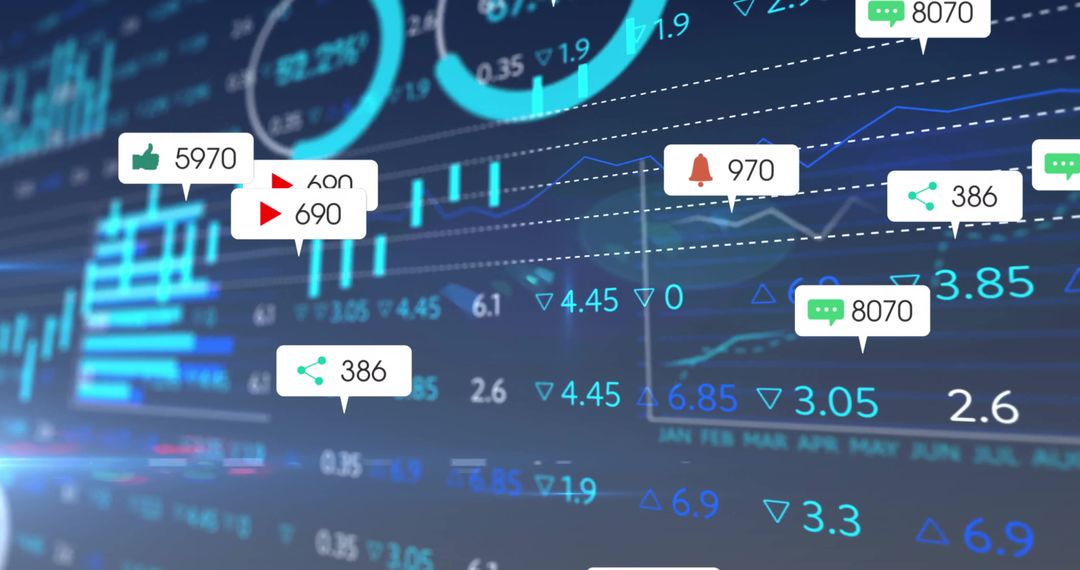
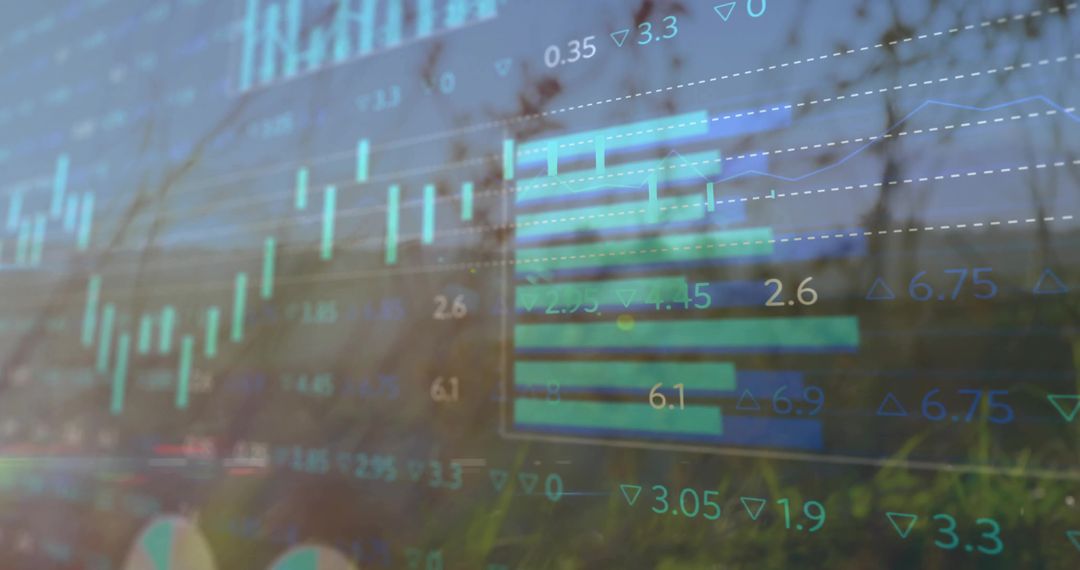
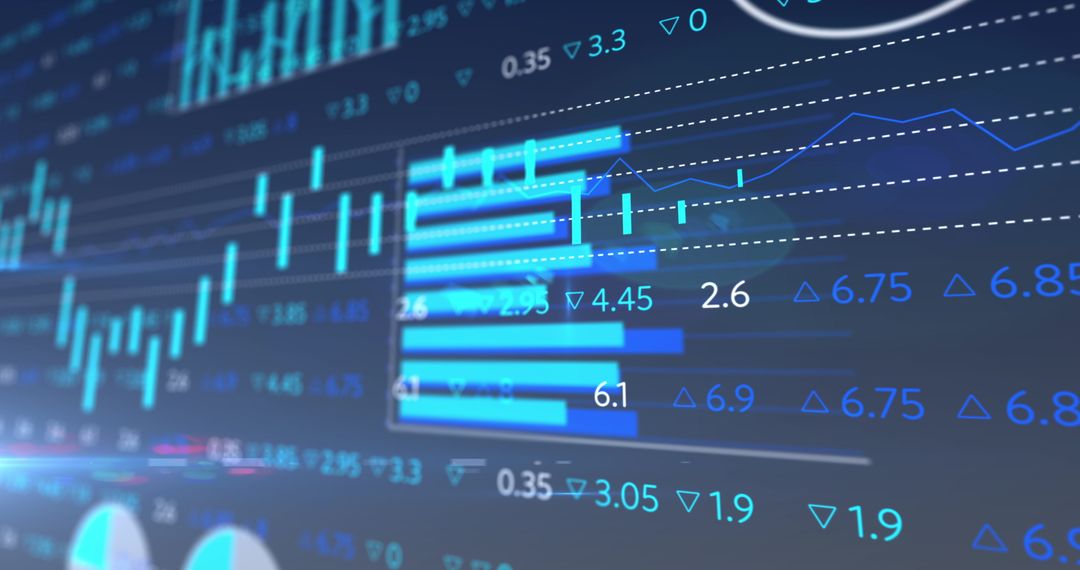
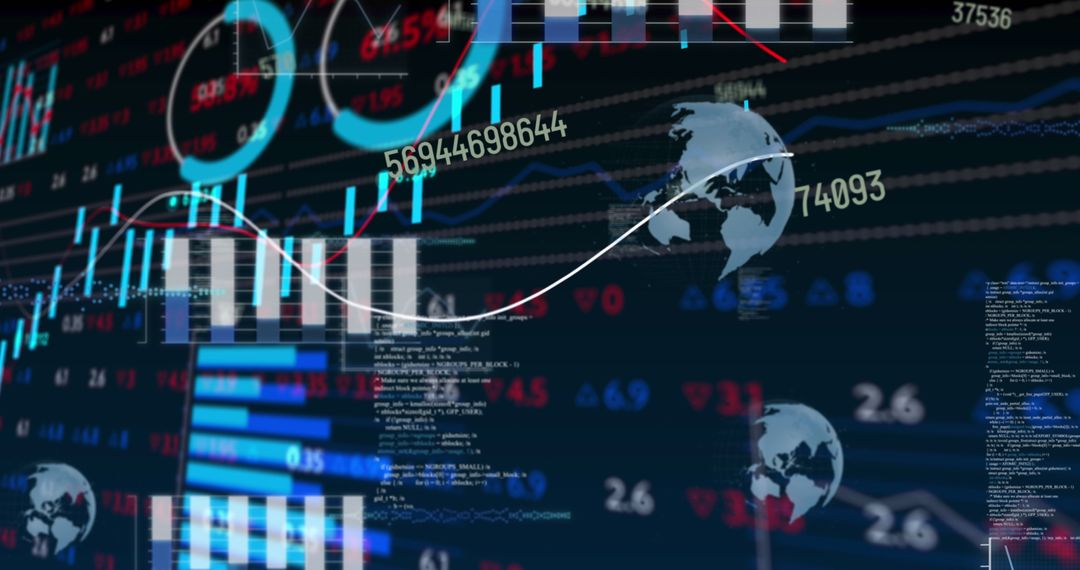
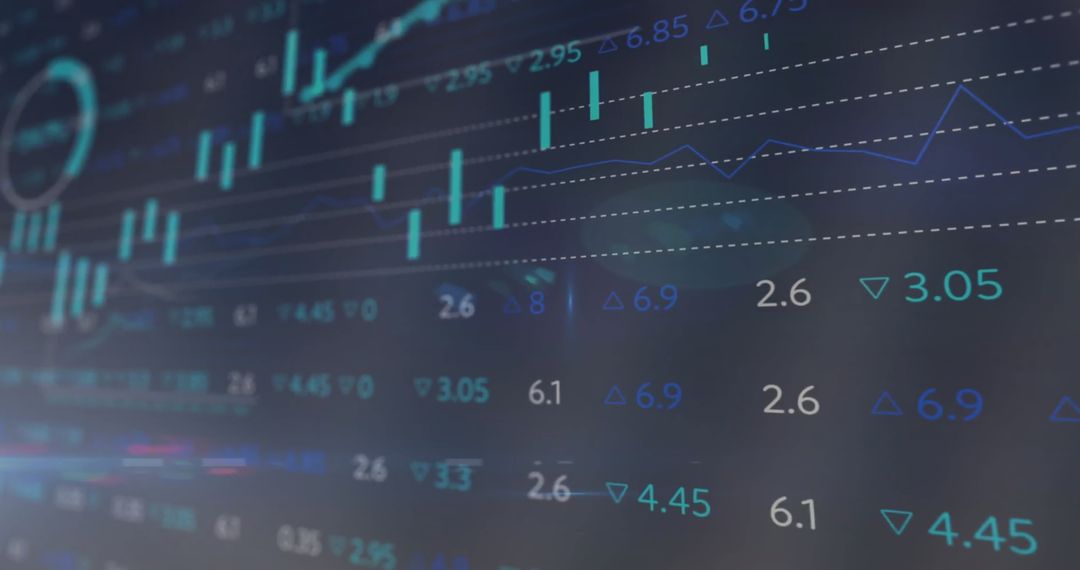
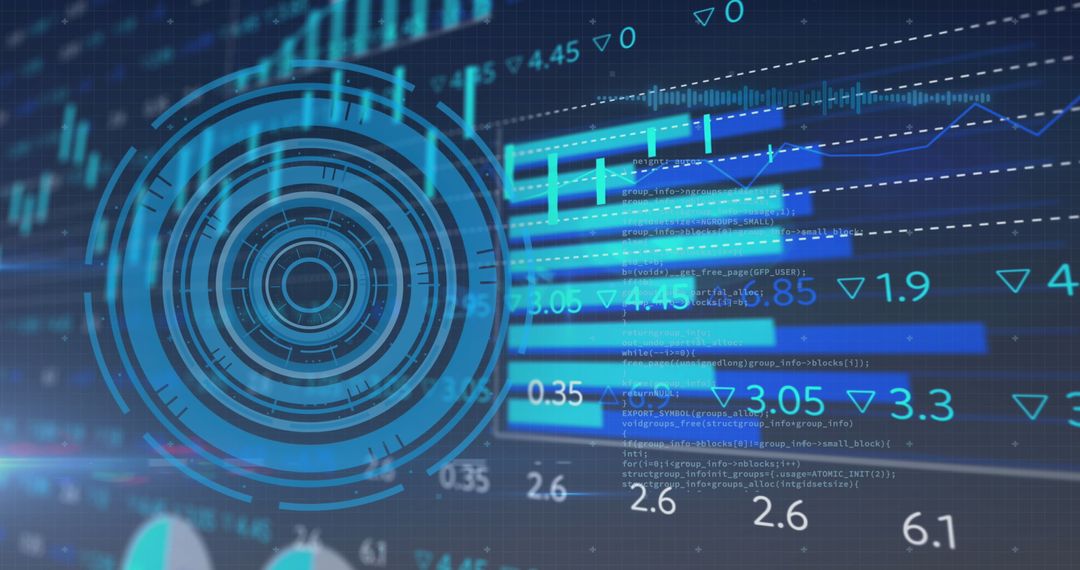
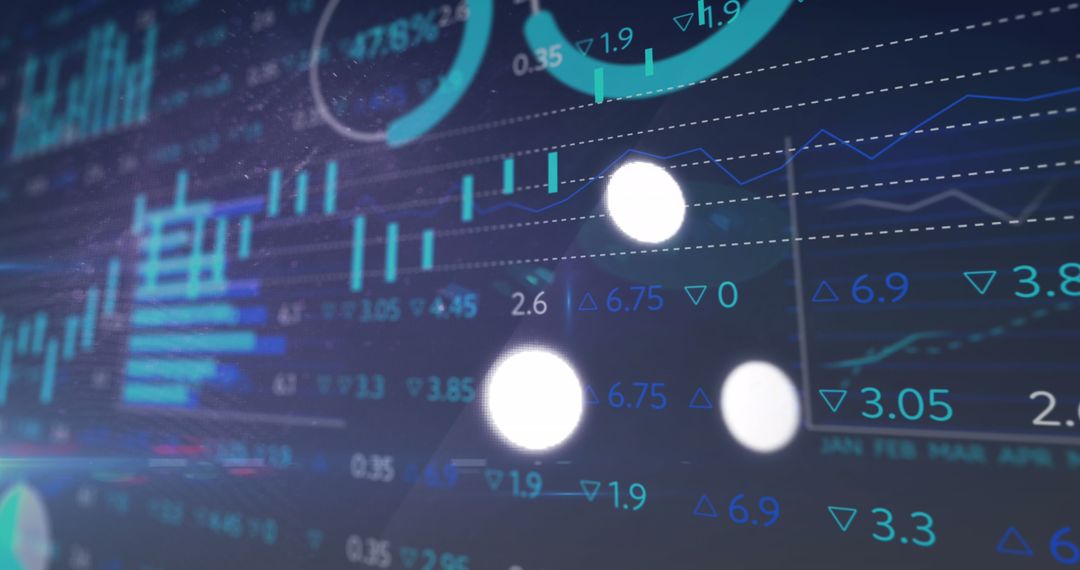
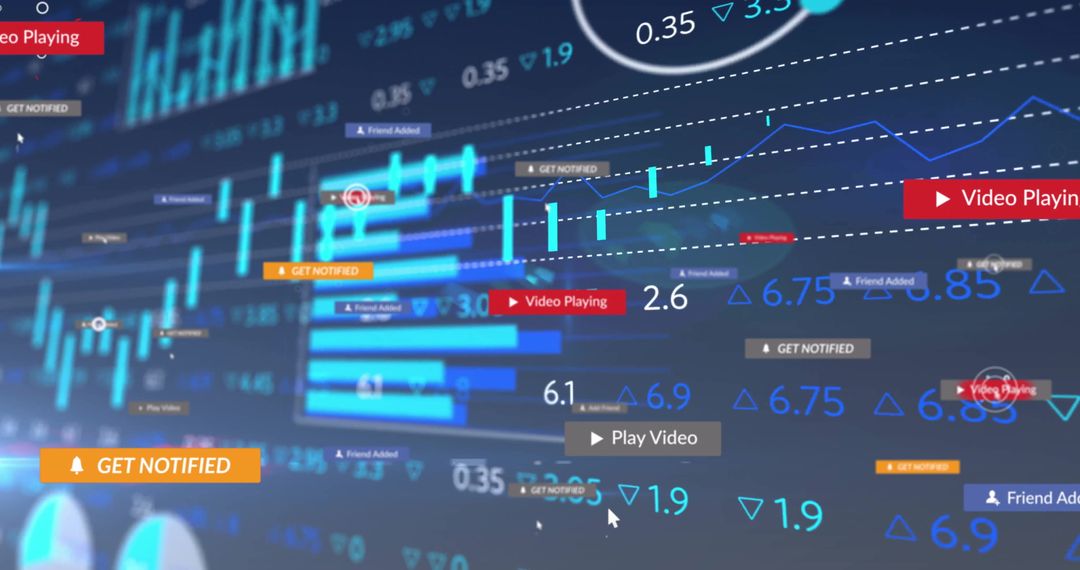
- Modern Financial Charts with Data Overlay and Highlights
Modern Financial Charts with Data Overlay and Highlights Image
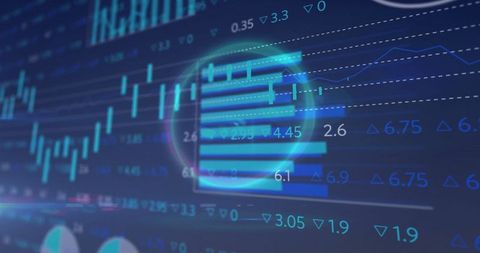
Financial charts updating in real-time provide a modern view of investment and trading analysis. Equipped with indicators, bar charts, and circular highlights, this visualization appeals to financial analysts and business professionals. Perfect for marketing materials related to stock market services, fintech companies, and educational resources on data analytics.
Powered by 


0
downloads
downloads
Tags:
More
Credit Photo
If you would like to credit the Photo, here are some ways you can do so
Text Link
photo Link
<span class="text-link">
<span>
<a target="_blank" href=https://pikwizard.com/photo/modern-financial-charts-with-data-overlay-and-highlights/839d6225f96f06f25b49aabbae87b1b5/>PikWizard</a>
</span>
</span>
<span class="image-link">
<span
style="margin: 0 0 20px 0; display: inline-block; vertical-align: middle; width: 100%;"
>
<a
target="_blank"
href="https://pikwizard.com/photo/modern-financial-charts-with-data-overlay-and-highlights/839d6225f96f06f25b49aabbae87b1b5/"
style="text-decoration: none; font-size: 10px; margin: 0;"
>
<img src="https://pikwizard.com/pw/medium/839d6225f96f06f25b49aabbae87b1b5.jpg" style="margin: 0; width: 100%;" alt="" />
<p style="font-size: 12px; margin: 0;">PikWizard</p>
</a>
</span>
</span>
Free (free of charge)
Free for personal and commercial use.
Author: People Creations
Similar Free Stock Images

Premium


Premium


Premium


Premium


Premium


Premium
Premium


Premium


Premium


Premium


Premium


Premium


Premium


Premium


Premium


Premium


Premium


Premium


Premium


Premium


Premium


Premium


Premium


Premium