
- Home >
- Stock Photos >
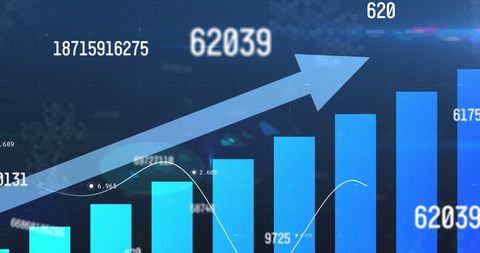
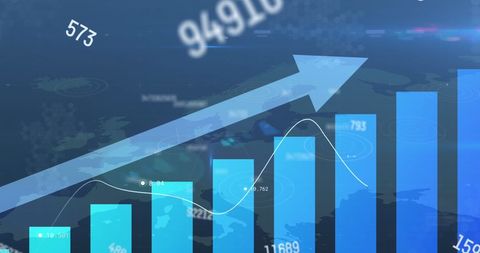
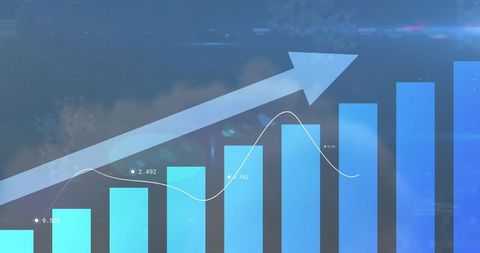
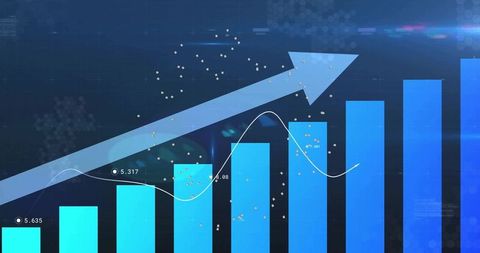
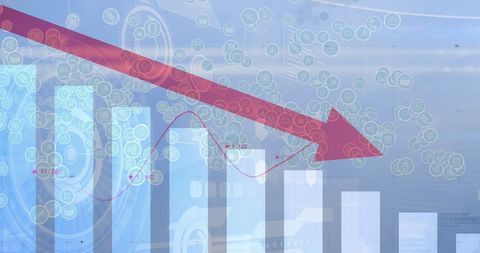
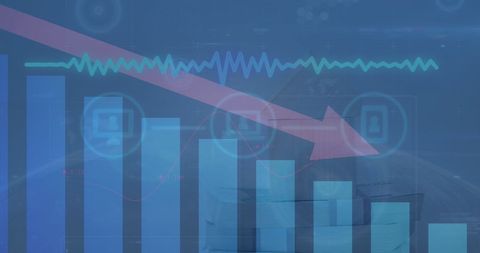
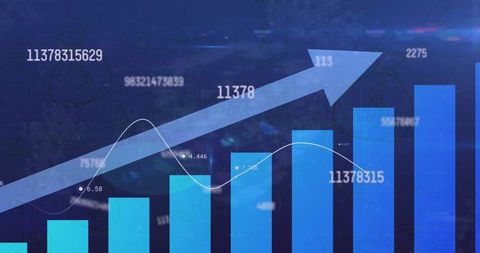
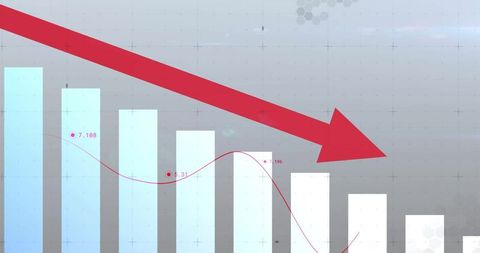
- Modern Financial Data Analysis with Graphs and Arrow
Modern Financial Data Analysis with Graphs and Arrow Image

Image depicts financial data processing with an arrow indicating trends. Suitable for business presentations, financial reports, economic research and investment analysis content to illustrate market dynamics and global economic trends.
Powered by  - Get 15% off with code: PIKWIZARD15


2
downloads
downloads
Tags:
More
Credit Photo
If you would like to credit the Photo, here are some ways you can do so
Text Link
photo Link
<span class="text-link">
<span>
<a target="_blank" href=https://pikwizard.com/photo/modern-financial-data-analysis-with-graphs-and-arrow/6216d4846e83a304488f540afac4ff1e/>PikWizard</a>
</span>
</span>
<span class="image-link">
<span
style="margin: 0 0 20px 0; display: inline-block; vertical-align: middle; width: 100%;"
>
<a
target="_blank"
href="https://pikwizard.com/photo/modern-financial-data-analysis-with-graphs-and-arrow/6216d4846e83a304488f540afac4ff1e/"
style="text-decoration: none; font-size: 10px; margin: 0;"
>
<img src="https://pikwizard.com/pw/medium/6216d4846e83a304488f540afac4ff1e.jpg" style="margin: 0; width: 100%;" alt="" />
<p style="font-size: 12px; margin: 0;">PikWizard</p>
</a>
</span>
</span>
Free (free of charge)
Free for personal and commercial use.
Author: People Creations
Similar Free Stock Images
Loading...

Premium

Premium


Premium


Premium


Premium


Premium

Premium


Premium

Premium


Premium

Premium


Premium


Premium


Premium


Premium


Premium


Premium


Premium


Premium


Premium

Premium


Premium

Premium

Premium


Premium

