
- Home >
- Stock Photos >
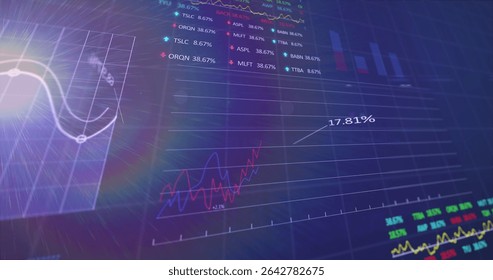
- Modern Financial Data Analytics Charts and Graph Visualizations
Modern Financial Data Analytics Charts and Graph Visualizations Image

Visual showcases dynamic financial data through colorful graphs and charts, ideal for illustrating modern business analytics and portraying corporate trends. This visual can be used in presentations, reports, or websites focusing on financial technology, business strategies, or statistical analysis.
Powered by  - Get 15% off with code: PIKWIZARD15


downloads
Tags:
More
Credit Photo
If you would like to credit the Photo, here are some ways you can do so
Text Link
photo Link
<span class="text-link">
<span>
<a target="_blank" href=https://pikwizard.com/photo/modern-financial-data-analytics-charts-and-graph-visualizations/79481072141e5b3783daf1c031600ac2/>PikWizard</a>
</span>
</span>
<span class="image-link">
<span
style="margin: 0 0 20px 0; display: inline-block; vertical-align: middle; width: 100%;"
>
<a
target="_blank"
href="https://pikwizard.com/photo/modern-financial-data-analytics-charts-and-graph-visualizations/79481072141e5b3783daf1c031600ac2/"
style="text-decoration: none; font-size: 10px; margin: 0;"
>
<img src="https://pikwizard.com/pw/medium/79481072141e5b3783daf1c031600ac2.jpg" style="margin: 0; width: 100%;" alt="" />
<p style="font-size: 12px; margin: 0;">PikWizard</p>
</a>
</span>
</span>
Free (free of charge)
Free for personal and commercial use.
Author: People Creations
Similar Free Stock Images

Premium


Premium

Premium


Premium


Premium


Premium


Premium

Premium

Premium

Premium


Premium


Premium


Premium


Premium


Premium


Premium


Premium


Premium


Premium


Premium

Premium


Premium


Premium


Premium


Premium


Explore More Free Stock Images