
- Home >
- Stock Photos >
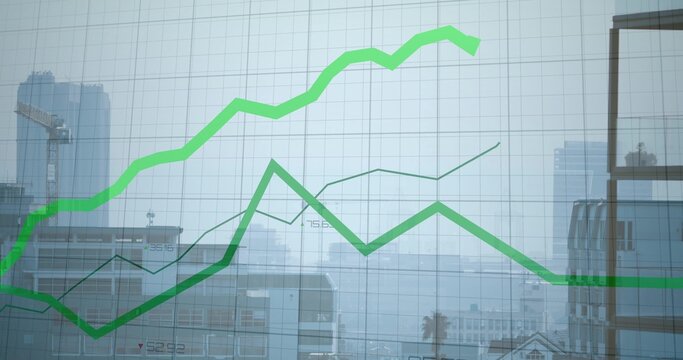
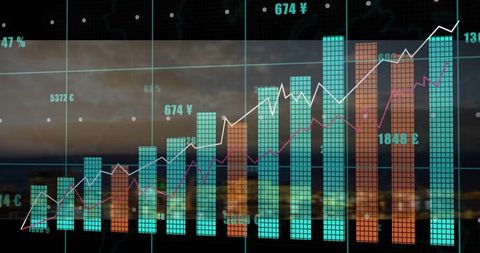
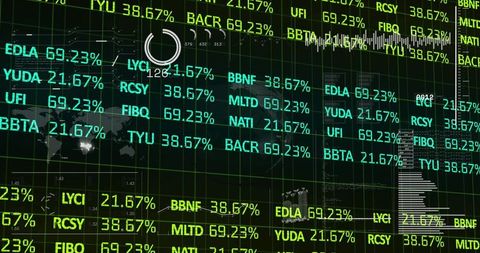
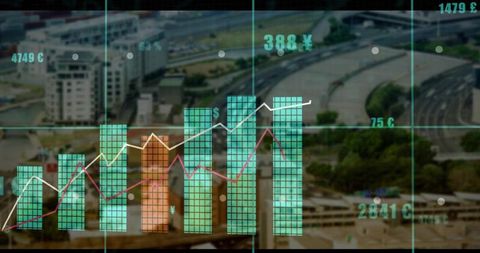
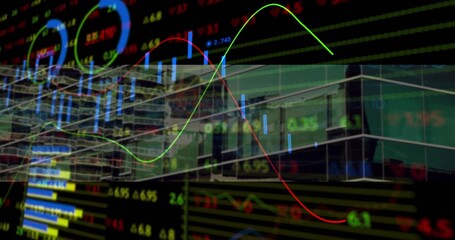
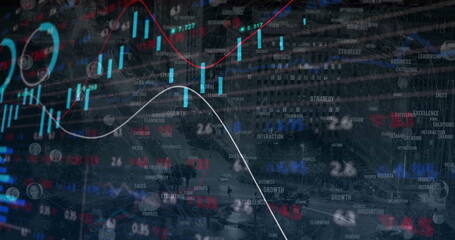
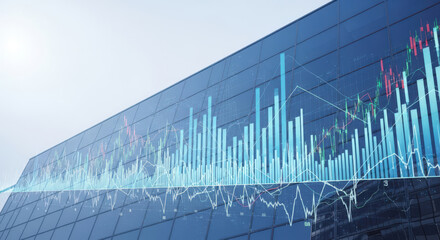
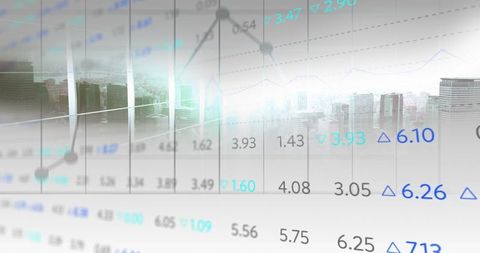
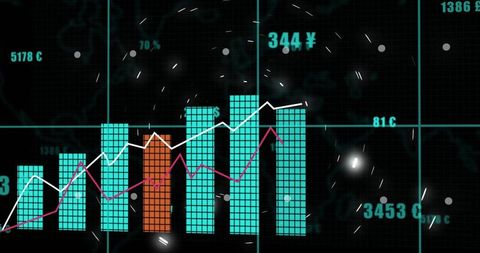
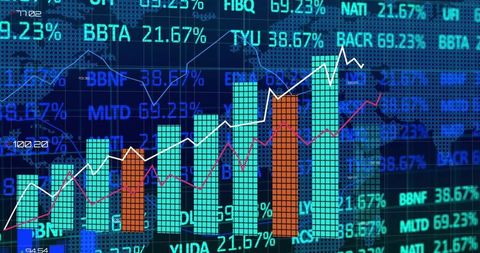
- Modern Financial Data Visualization on Urban Facade
Modern Financial Data Visualization on Urban Facade Image

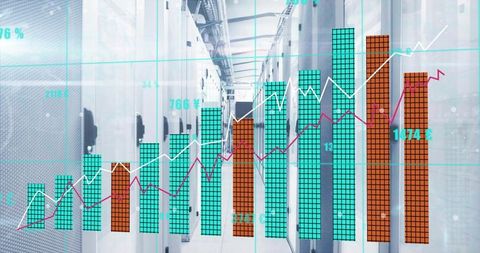
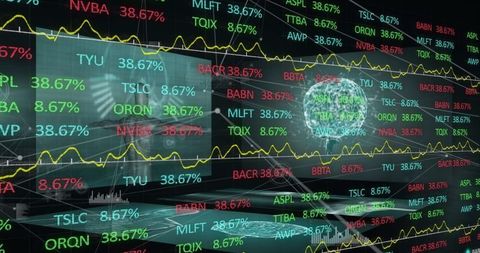
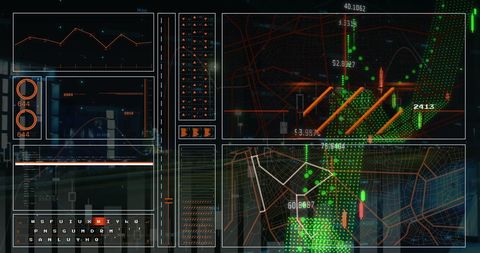
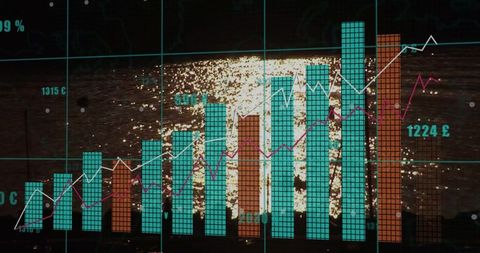
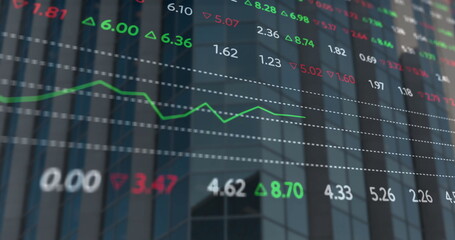
Modern financial data visualization displayed on an urban building's exterior. Teal and orange bars, along with white and magenta lines, represent various financial metrics with currency labels along the axes. This visually striking design combines corporate and technology themes, lending itself to uses in investments, business presentations, and financial analytics materials focusing on urban development and technology innovations.
Powered by 


downloads
Tags:
More
Credit Photo
If you would like to credit the Photo, here are some ways you can do so
Text Link
photo Link
<span class="text-link">
<span>
<a target="_blank" href=https://pikwizard.com/photo/modern-financial-data-visualization-on-urban-facade/6aba9a6bc000116fa7d677fca4fa3556/>PikWizard</a>
</span>
</span>
<span class="image-link">
<span
style="margin: 0 0 20px 0; display: inline-block; vertical-align: middle; width: 100%;"
>
<a
target="_blank"
href="https://pikwizard.com/photo/modern-financial-data-visualization-on-urban-facade/6aba9a6bc000116fa7d677fca4fa3556/"
style="text-decoration: none; font-size: 10px; margin: 0;"
>
<img src="https://pikwizard.com/pw/medium/6aba9a6bc000116fa7d677fca4fa3556.jpg" style="margin: 0; width: 100%;" alt="" />
<p style="font-size: 12px; margin: 0;">PikWizard</p>
</a>
</span>
</span>
Free (free of charge)
Free for personal and commercial use.
Author: Creative Art
Similar Free Stock Images

Premium


Premium

Premium


Premium


Premium


Premium


Premium


Premium


Premium


Premium


Premium


Premium


Premium


Premium


Premium


Premium


Premium


Premium


Premium


Premium
Premium


Premium


Premium


Premium


Premium


Explore More Free Stock Images