
- Home >
- Stock Photos >
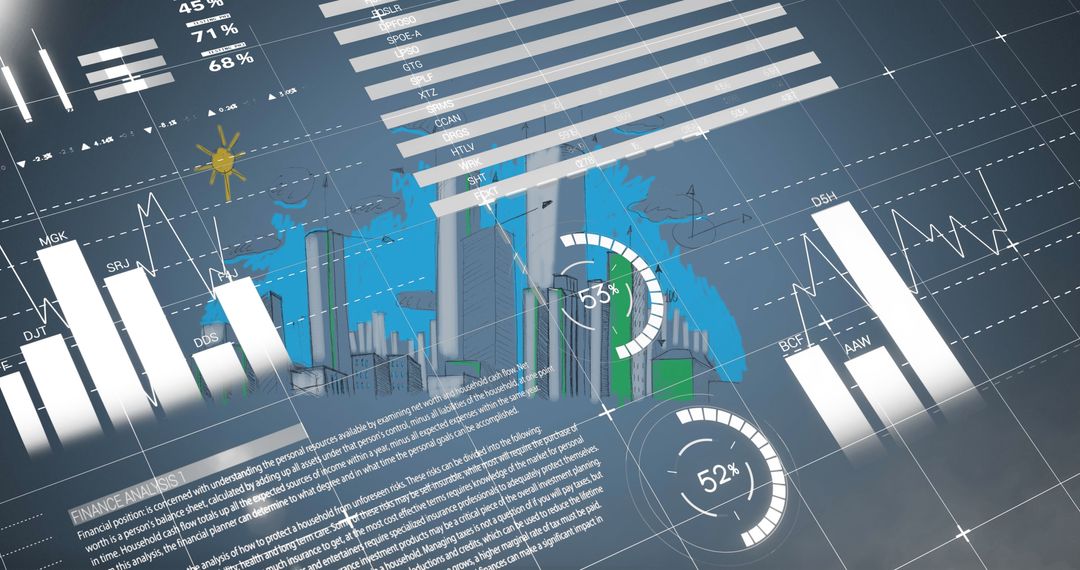
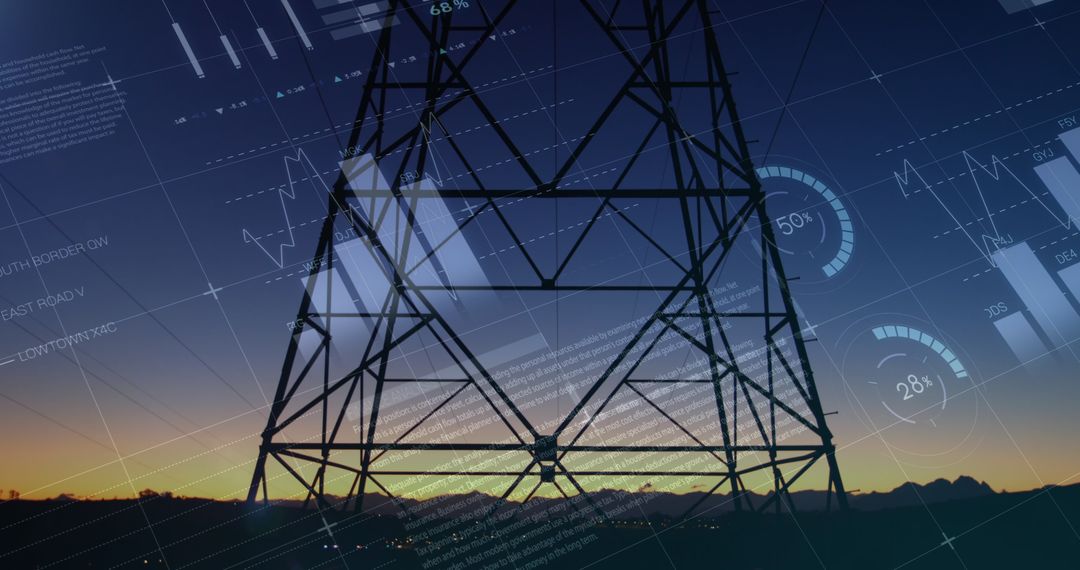
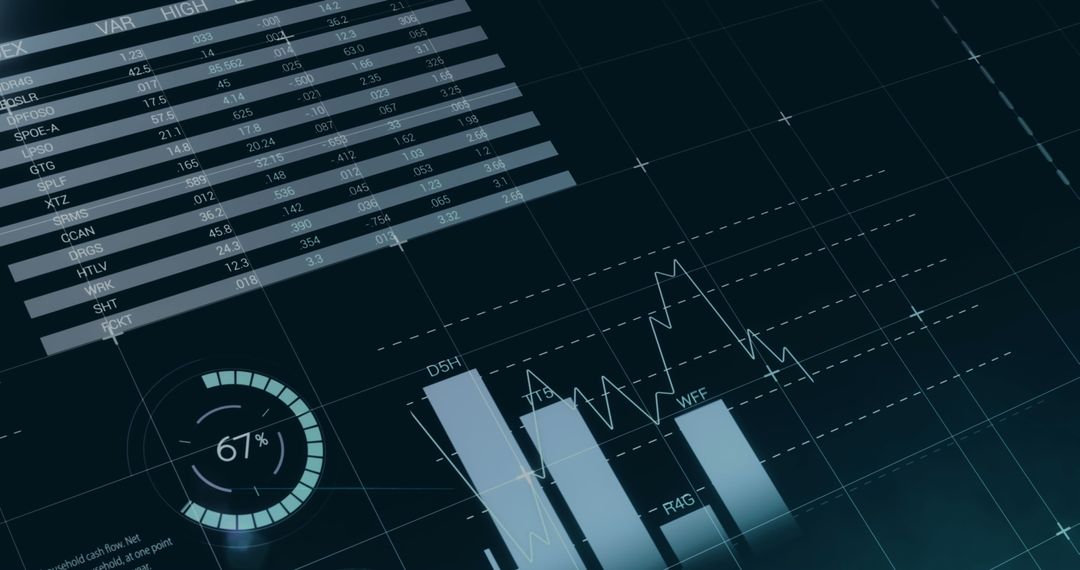
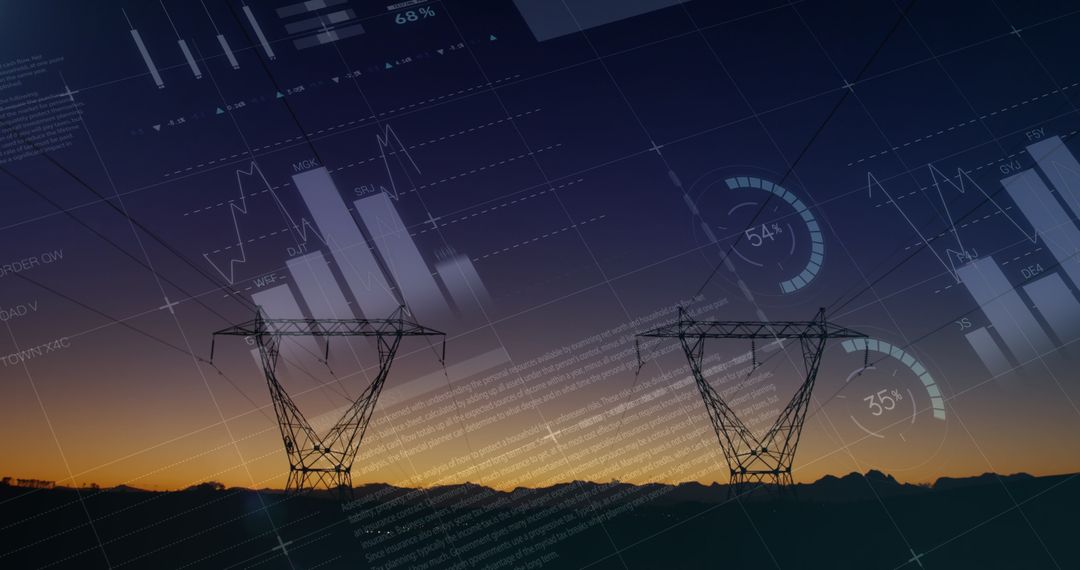
- Modern Technology Displaying Digital Graphs and Transmission Tower
Modern Technology Displaying Digital Graphs and Transmission Tower Image

Illustrates modern tech overlay of graphs and statistics on a transmission tower. Use in energy sector presentations, tech innovations, or visualizing power distribution. Suitable for topics on digital data analysis and power grid management.
Powered by 


2
downloads
downloads
Tags:
More
Credit Photo
If you would like to credit the Photo, here are some ways you can do so
Text Link
photo Link
<span class="text-link">
<span>
<a target="_blank" href=https://pikwizard.com/photo/modern-technology-displaying-digital-graphs-and-transmission-tower/a6fadac2656ddda93de36d9d98d4c1da/>PikWizard</a>
</span>
</span>
<span class="image-link">
<span
style="margin: 0 0 20px 0; display: inline-block; vertical-align: middle; width: 100%;"
>
<a
target="_blank"
href="https://pikwizard.com/photo/modern-technology-displaying-digital-graphs-and-transmission-tower/a6fadac2656ddda93de36d9d98d4c1da/"
style="text-decoration: none; font-size: 10px; margin: 0;"
>
<img src="https://pikwizard.com/pw/medium/a6fadac2656ddda93de36d9d98d4c1da.jpg" style="margin: 0; width: 100%;" alt="" />
<p style="font-size: 12px; margin: 0;">PikWizard</p>
</a>
</span>
</span>
Free (free of charge)
Free for personal and commercial use.
Author: Authentic Images
Similar Free Stock Images

Premium


Premium


Premium


Premium


Premium


Premium


Premium


Premium


Premium


Premium


Premium


Premium


Premium


Premium


Premium


Premium


Premium


Premium


Premium


Premium


Premium


Premium


Premium


Premium

