
- Home >
- Stock Photos >
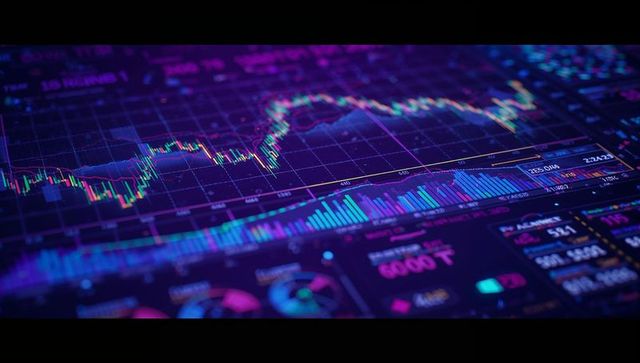
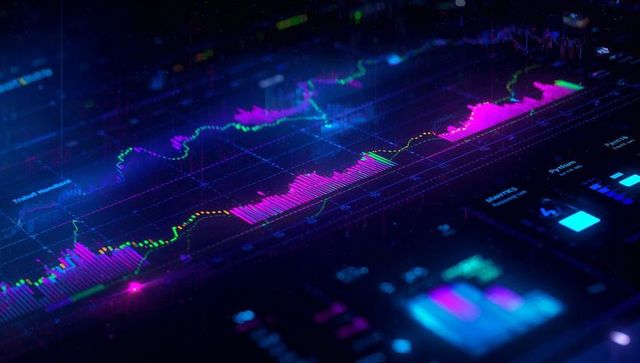
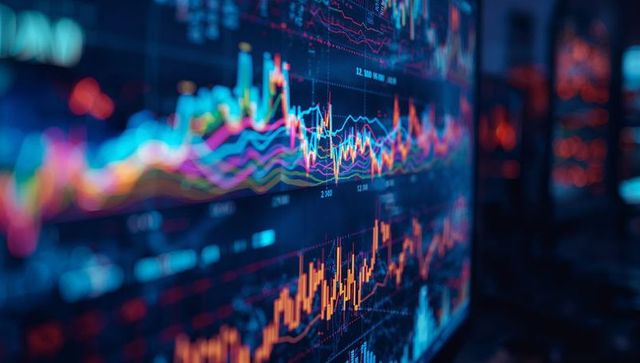
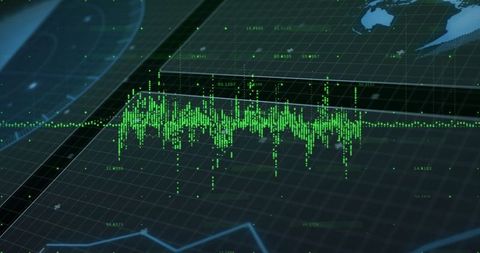
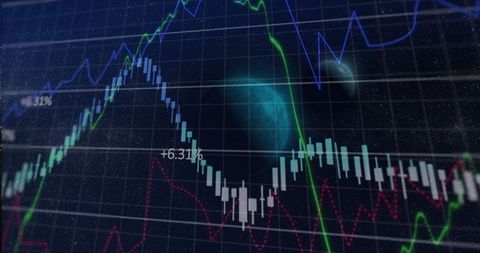
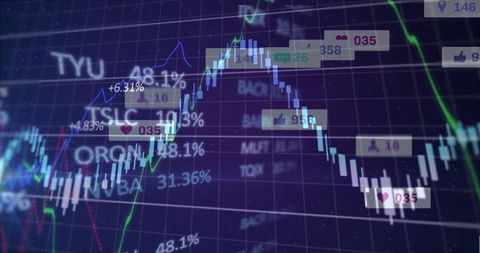
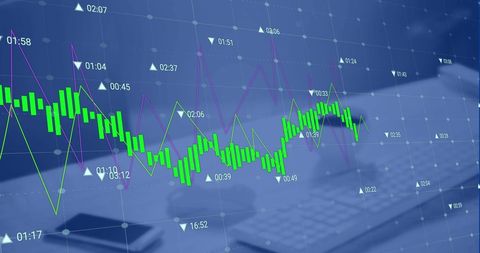
- Modern Trading Dashboard with Candlestick and Graph Data Points
Modern Trading Dashboard with Candlestick and Graph Data Points Image
AI
AI Generated Image. Stock visualization showcasing trading analytics with detailed candlestick charts, volume histograms, and ticker panels. Suitable for financial articles, trading platforms, investment presentations, and educational material about modern trading technology.

downloads
Tags:
More
Credit Photo
If you would like to credit the Photo, here are some ways you can do so
Text Link
photo Link
<span class="text-link">
<span>
<a target="_blank" href=https://pikwizard.com/photo/modern-trading-dashboard-with-candlestick-and-graph-data-points/7beb47662e33a9b89a8aff1b24d6d2af/>PikWizard</a>
</span>
</span>
<span class="image-link">
<span
style="margin: 0 0 20px 0; display: inline-block; vertical-align: middle; width: 100%;"
>
<a
target="_blank"
href="https://pikwizard.com/photo/modern-trading-dashboard-with-candlestick-and-graph-data-points/7beb47662e33a9b89a8aff1b24d6d2af/"
style="text-decoration: none; font-size: 10px; margin: 0;"
>
<img src="https://pikwizard.com/pw/medium/7beb47662e33a9b89a8aff1b24d6d2af.jpg" style="margin: 0; width: 100%;" alt="" />
<p style="font-size: 12px; margin: 0;">PikWizard</p>
</a>
</span>
</span>
Free (free of charge)
Free for personal and commercial use.
Author: AI Creator
Similar Free Stock Images

AI


AI


AI


AI


AI


AI

AI


AI


AI


Explore More Free Stock Images