
- Home >
- Stock Photos >
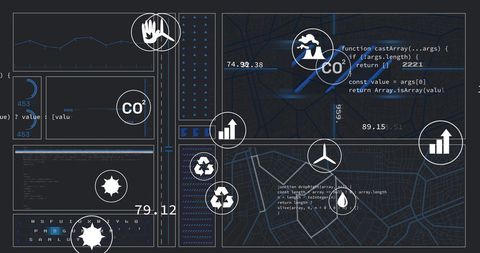
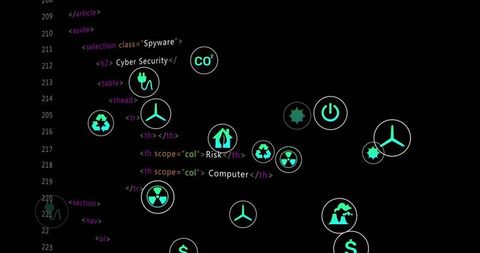
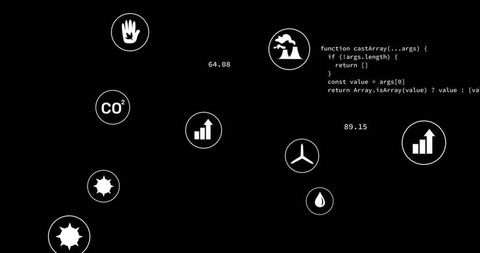
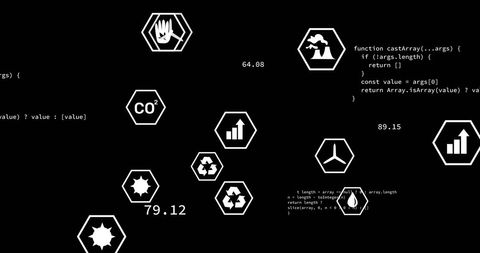
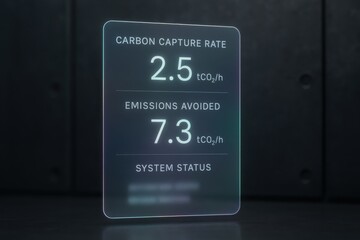
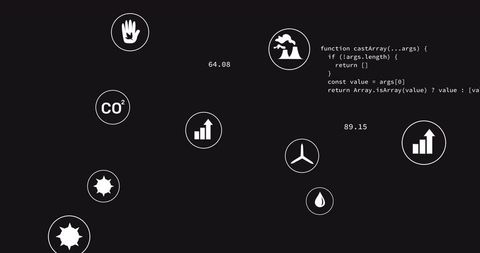
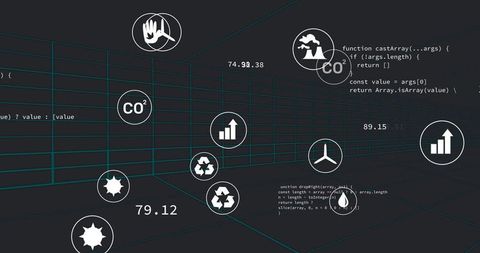
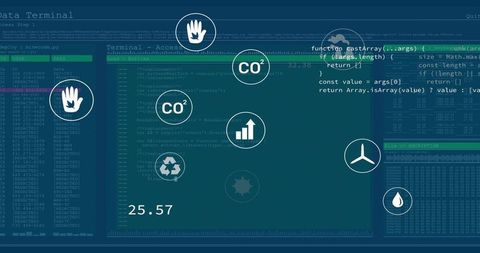
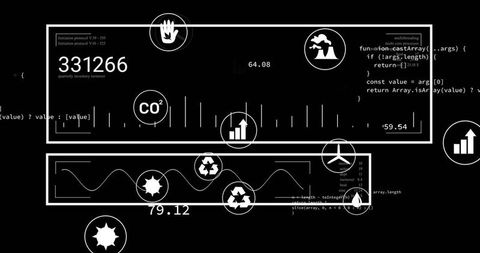
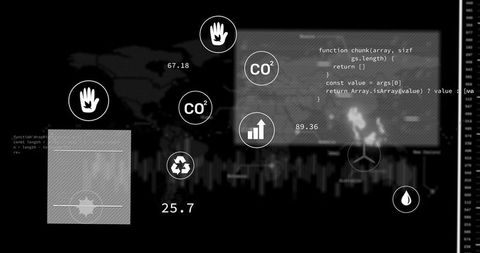
- Monitoring CO2 Emissions Dashboard with JavaScript Code, Volcano, Turbine and Metrics
Monitoring CO2 Emissions Dashboard with JavaScript Code, Volcano, Turbine and Metrics Image

Featuring monochrome icons and numeric metrics (64.08, 89.15) alongside JavaScript code snippet. Visualizing CO2 emissions, volcanic activity, turbine energy, water drop, and growth chart in minimalist dashboard layout. Highlighting contrast of white glyphs on black background for strong visual impact. Serving as header art for sustainability reports, website hero banners, tech blog posts, investor presentations, and data analytics case studies. Supporting UI concepts, dashboard templates, marketing for environmental monitoring tools, and educational materials on carbon tracking. Working well for banner, social media posts, slide deck backgrounds, annual report covers, and newsroom graphics. Encouraging pairing with bold typography, bright accent color, and concise data labels for clear storytelling.
Powered by 


downloads
Tags:
More
Credit Photo
If you would like to credit the Photo, here are some ways you can do so
Text Link
photo Link
<span class="text-link">
<span>
<a target="_blank" href=https://pikwizard.com/photo/monitoring-co2-emissions-dashboard-with-javascript-code-volcano-turbine-and-metrics/f816f7696aef88ef29c07e9ba74faf8f/>PikWizard</a>
</span>
</span>
<span class="image-link">
<span
style="margin: 0 0 20px 0; display: inline-block; vertical-align: middle; width: 100%;"
>
<a
target="_blank"
href="https://pikwizard.com/photo/monitoring-co2-emissions-dashboard-with-javascript-code-volcano-turbine-and-metrics/f816f7696aef88ef29c07e9ba74faf8f/"
style="text-decoration: none; font-size: 10px; margin: 0;"
>
<img src="https://pikwizard.com/pw/medium/f816f7696aef88ef29c07e9ba74faf8f.jpg" style="margin: 0; width: 100%;" alt="" />
<p style="font-size: 12px; margin: 0;">PikWizard</p>
</a>
</span>
</span>
Free (free of charge)
Free for personal and commercial use.
Author: People Creations
Similar Free Stock Images

Premium


Premium


Premium


Premium

Premium


Premium


Premium


Premium


Premium


Premium


Premium


Premium

Premium


Premium


Premium


Premium
Premium


Explore More Free Stock Images