- Home >
- Stock Photos >
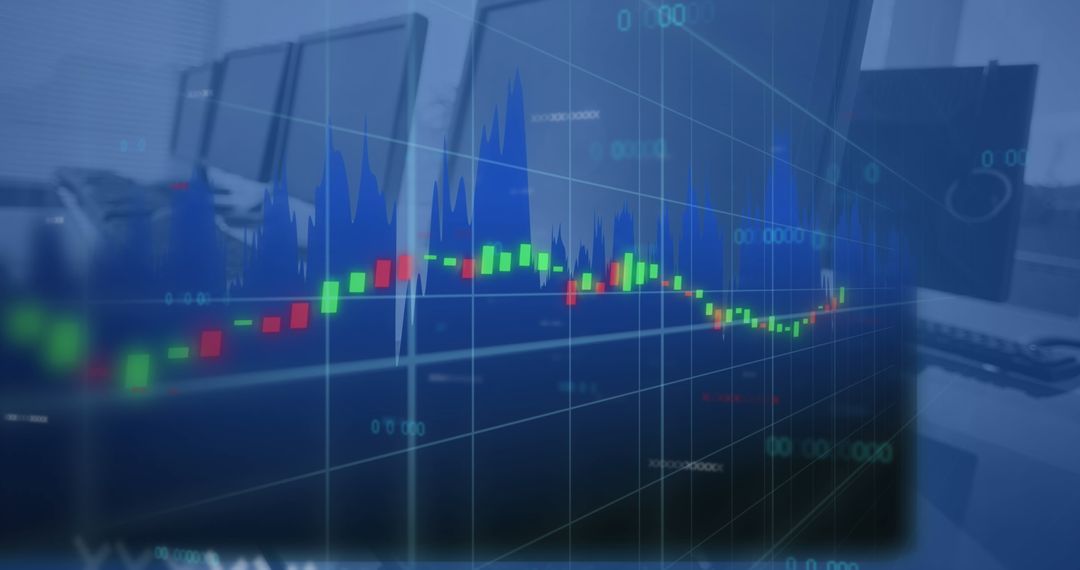
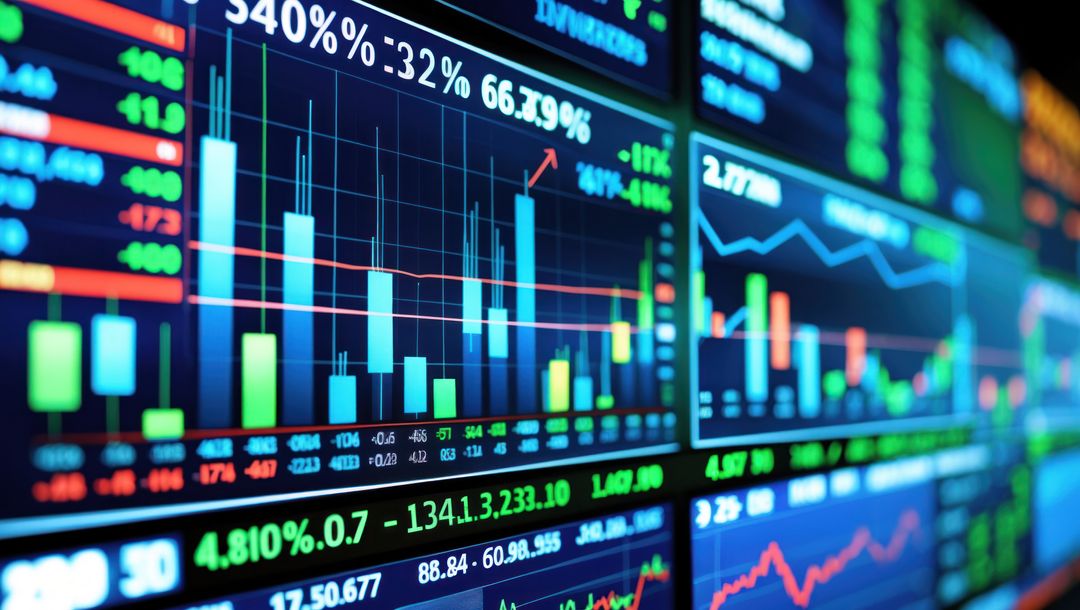
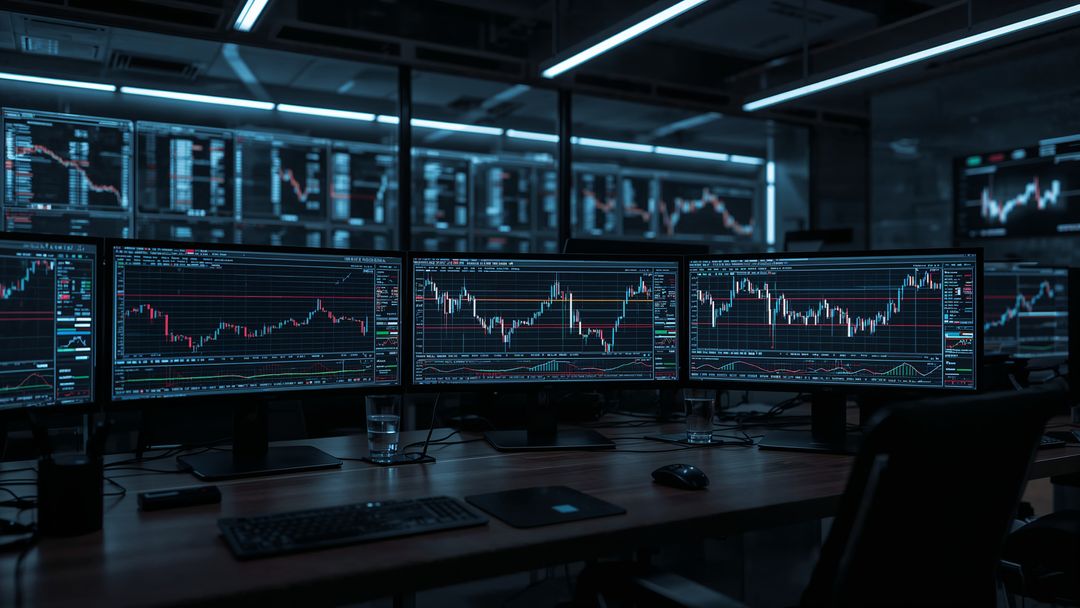
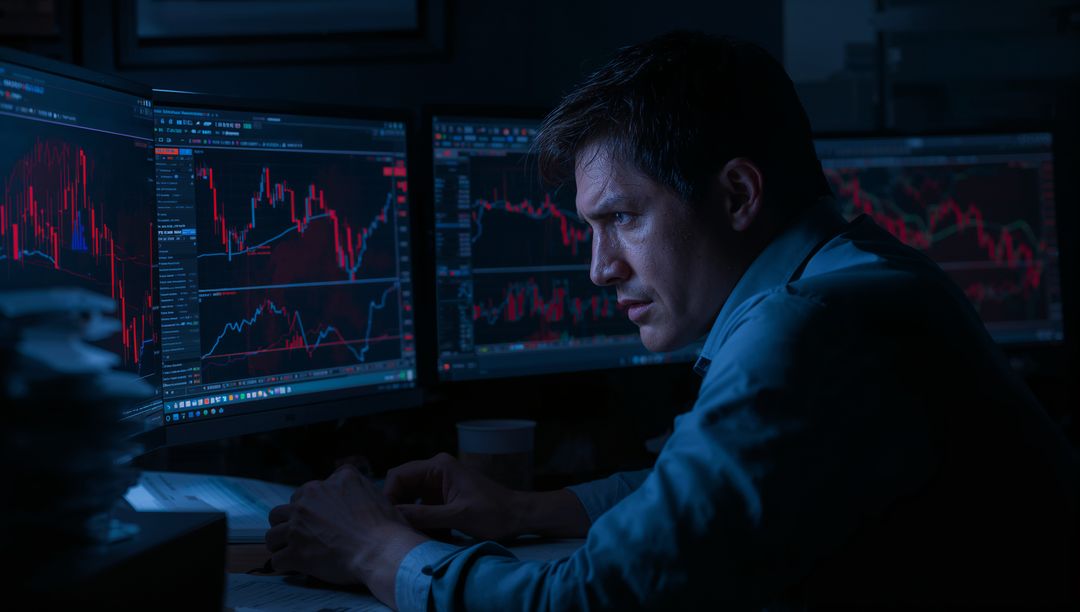
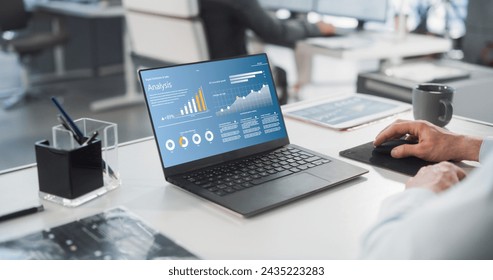
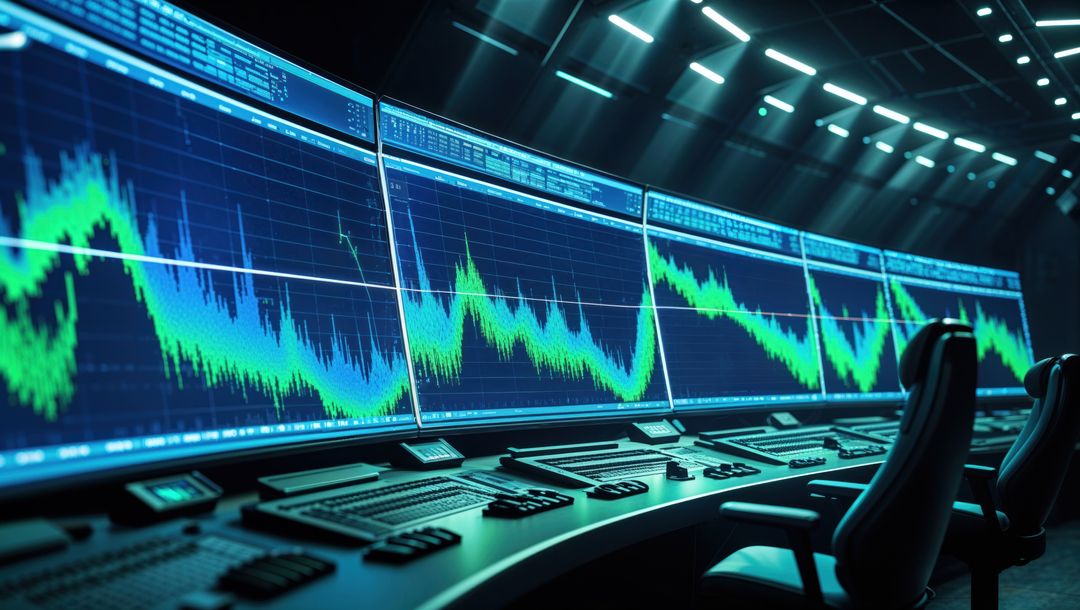
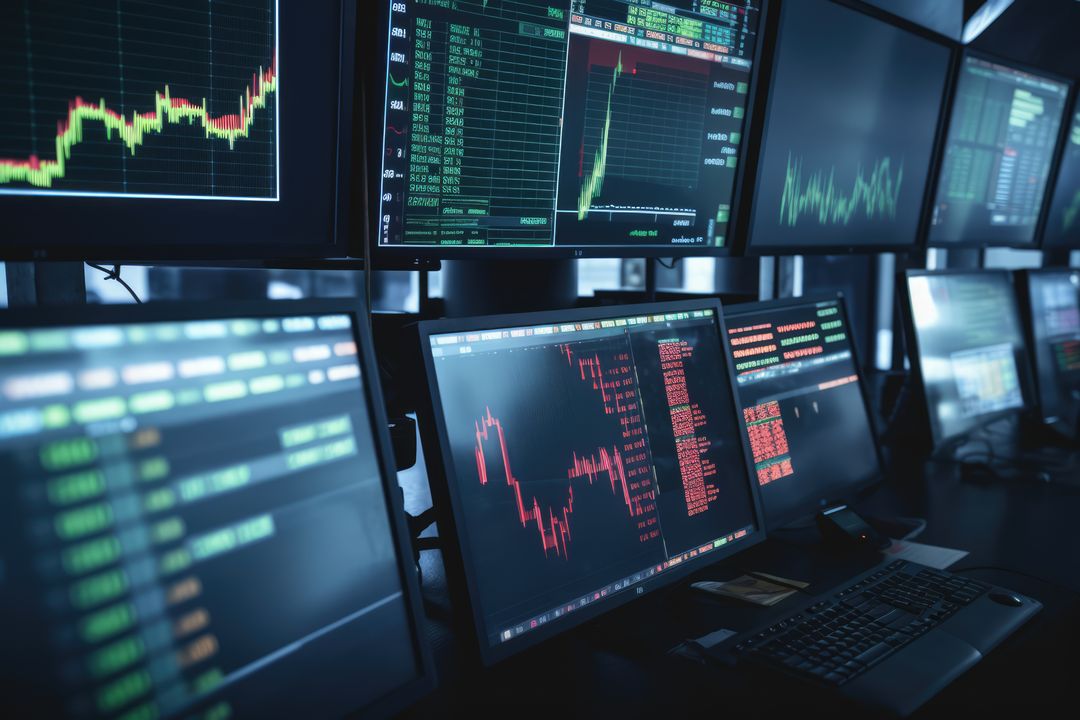
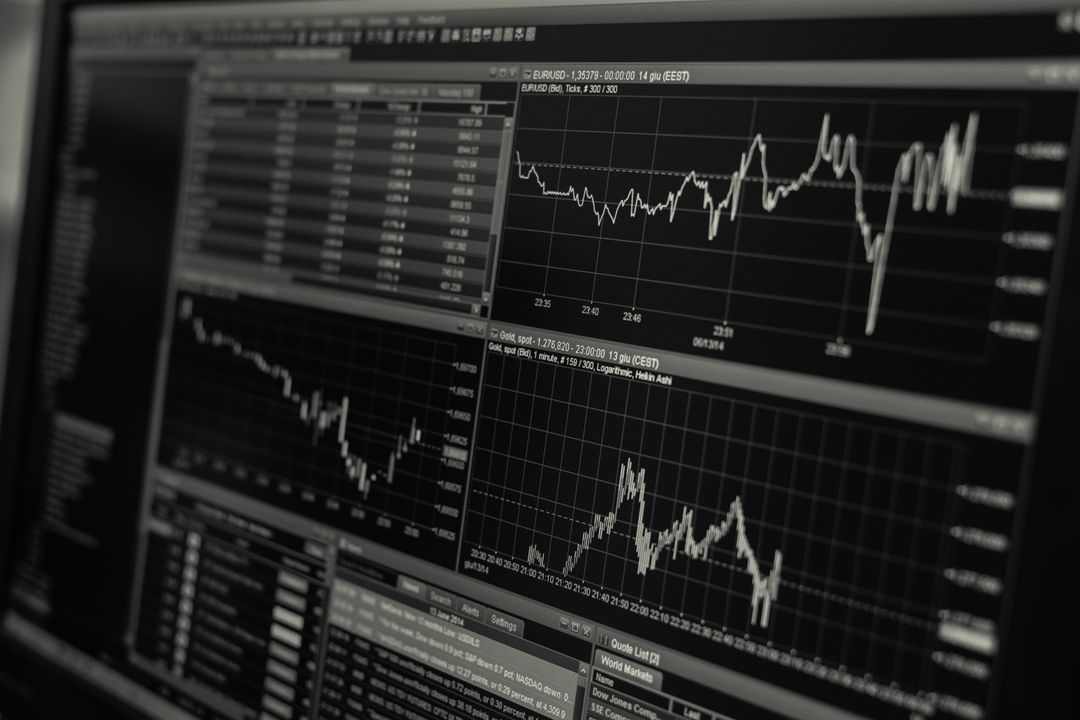
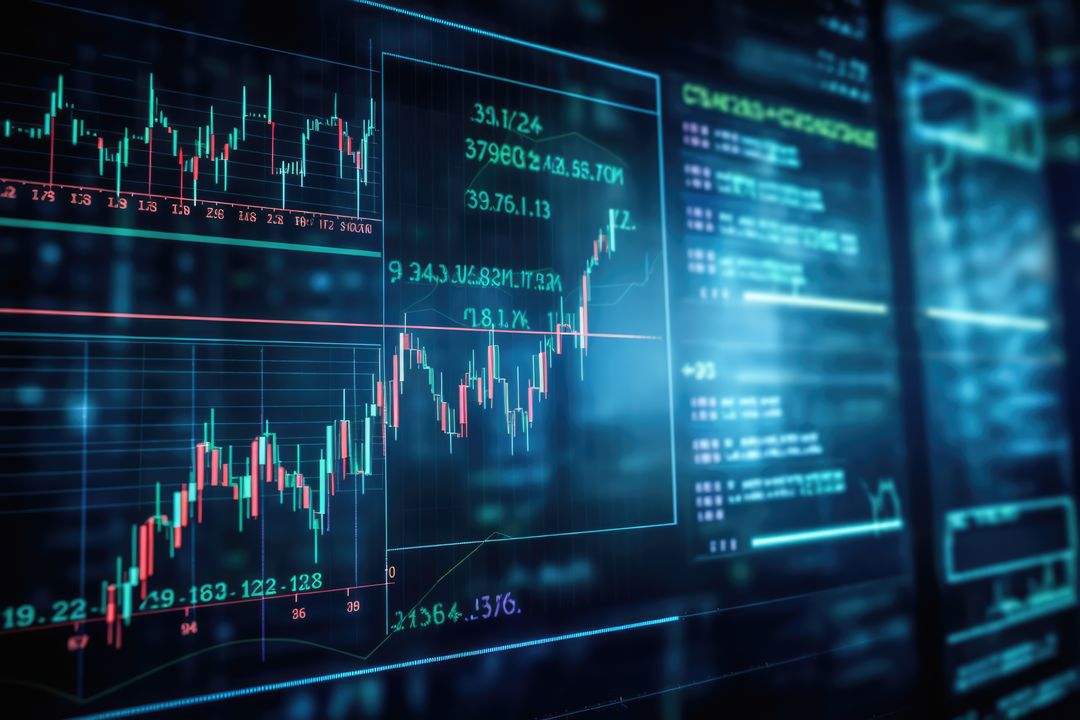
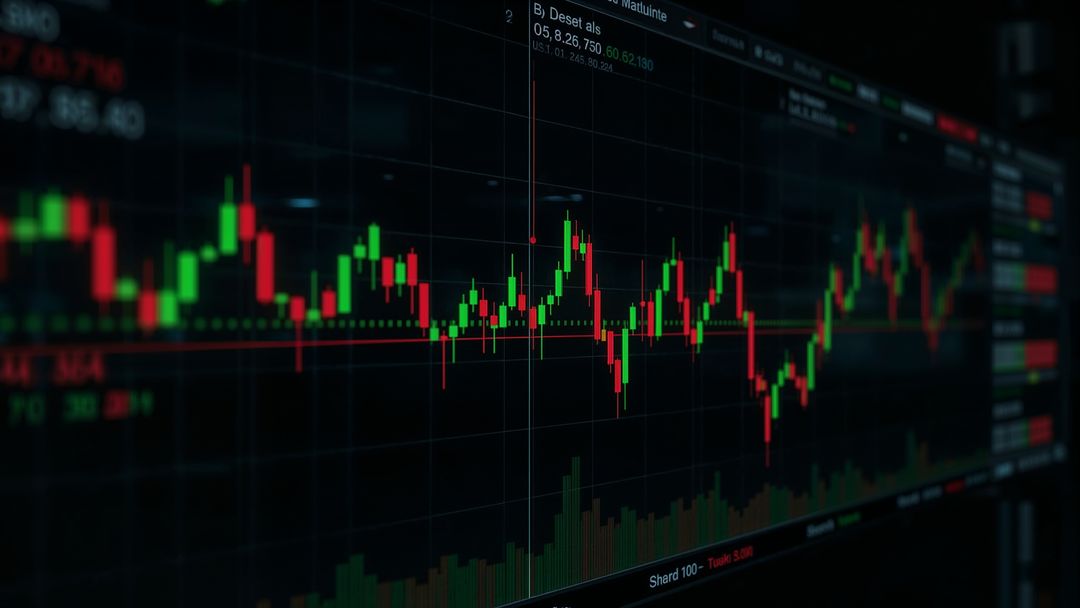
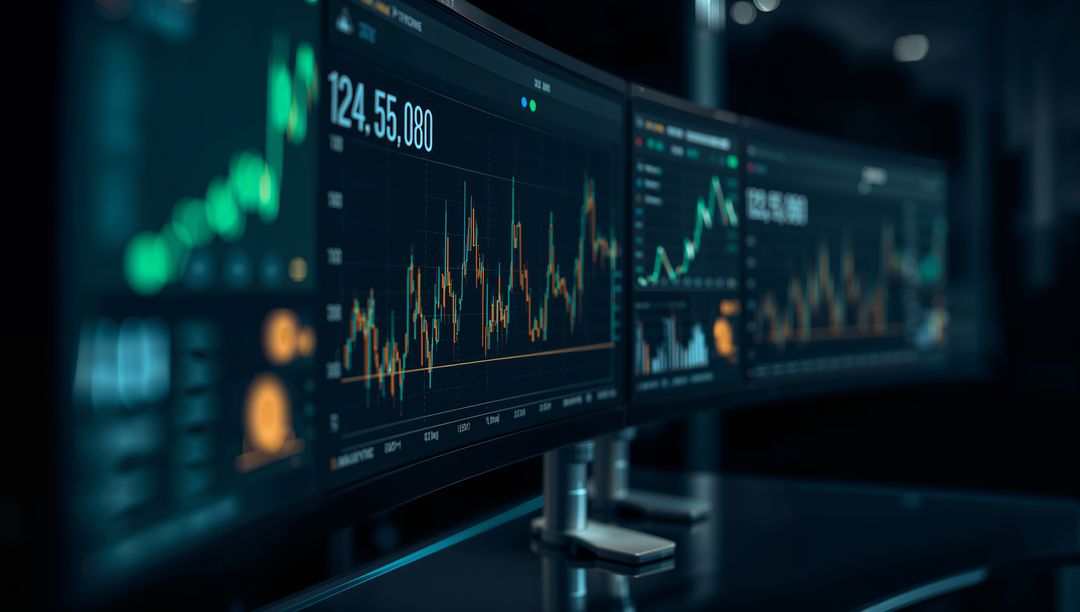
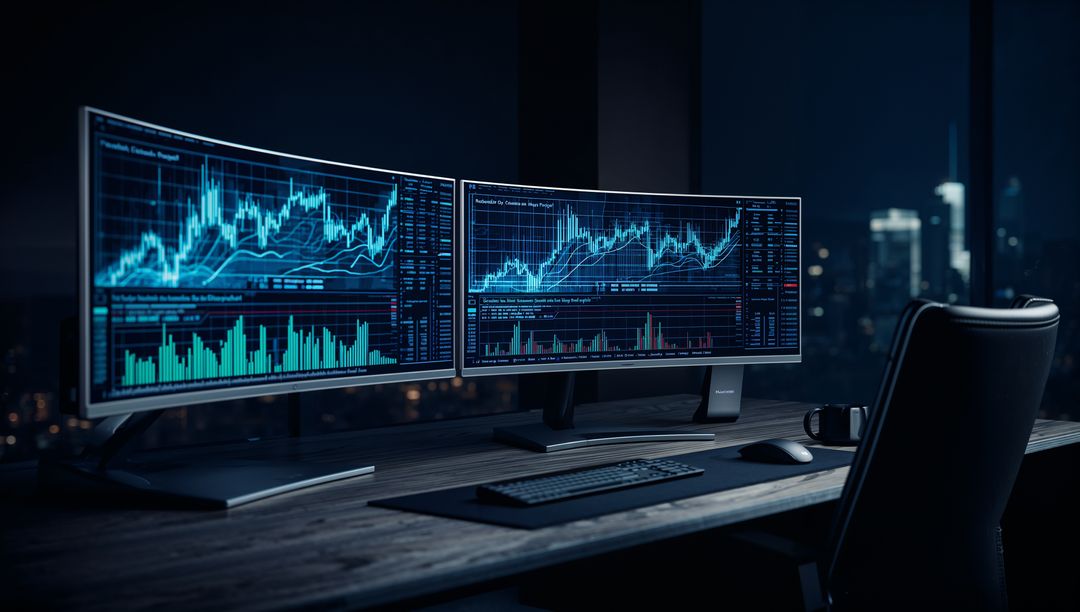
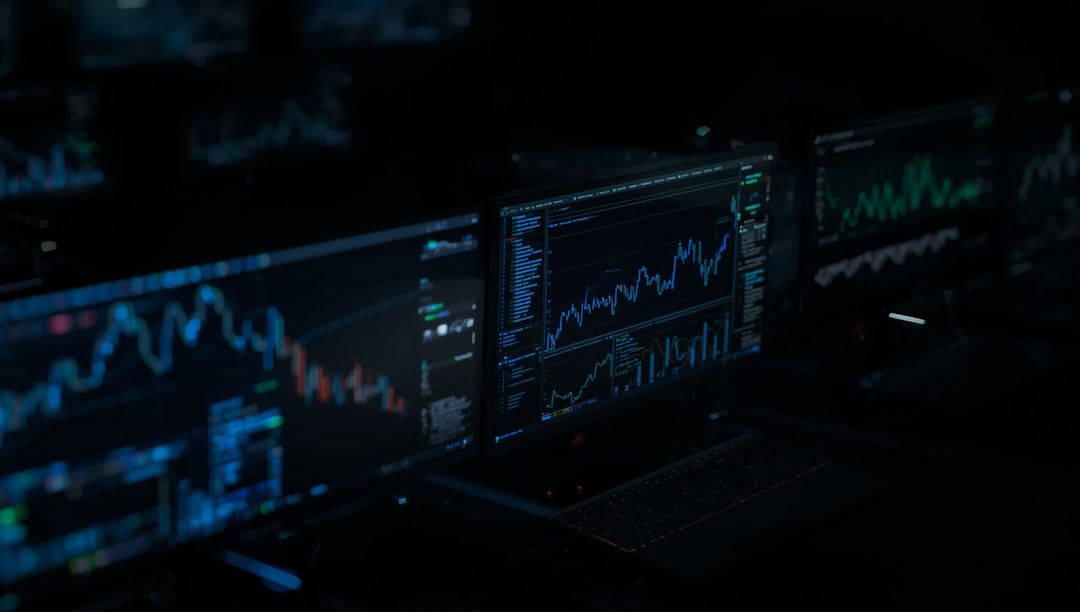
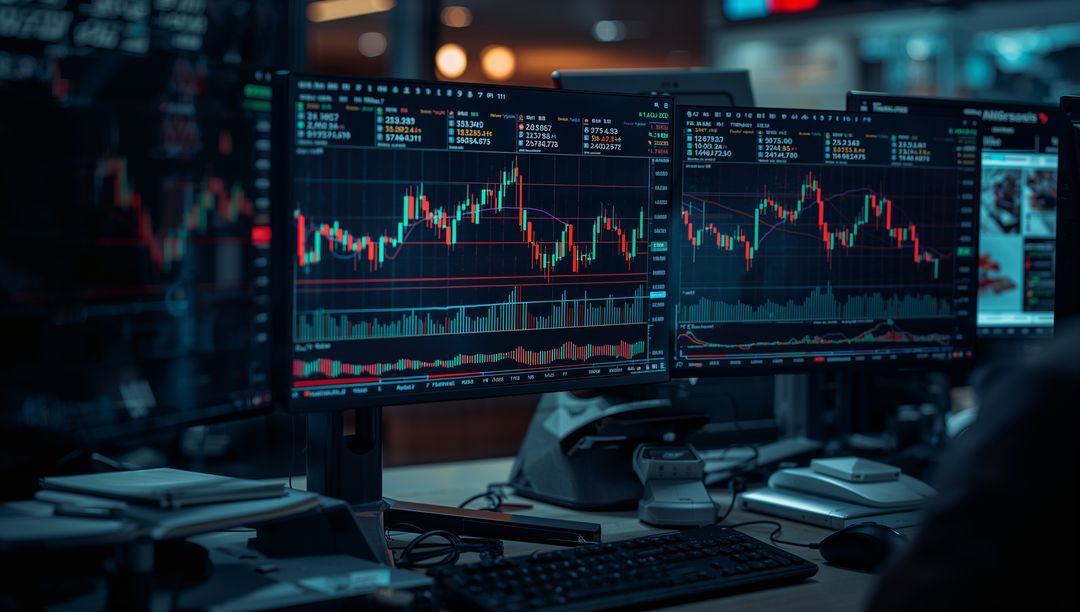
- Monitors Displaying Financial Charts in Modern Office Setting
Monitors Displaying Financial Charts in Modern Office Setting Image
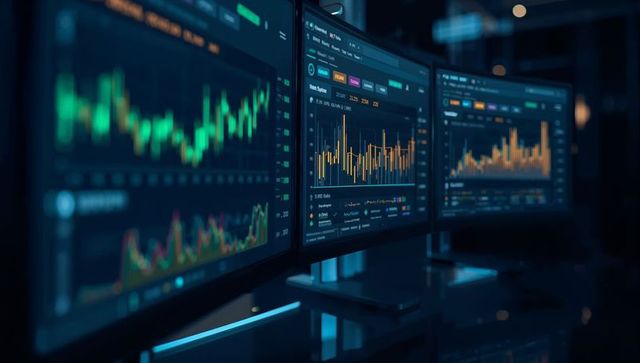
AI Generated Image. Monitors showcasing financial charts represent technological integration in modern financial workplaces. Useful for themes around business, finance, data analytics, technology in offices, investment strategies, and economic forecasting. Illustrates contemporary work environments in finance-related content.
Powered by  - Get 15% off with code: PIKWIZARD15


0
downloads
downloads
Tags:
More
Credit Photo
If you would like to credit the Photo, here are some ways you can do so
Text Link
photo Link
<span class="text-link">
<span>
<a target="_blank" href=https://pikwizard.com/photo/monitors-displaying-financial-charts-in-modern-office-setting/b45c2c7b4ce09b31e8acbbaf17c6eda0/>PikWizard</a>
</span>
</span>
<span class="image-link">
<span
style="margin: 0 0 20px 0; display: inline-block; vertical-align: middle; width: 100%;"
>
<a
target="_blank"
href="https://pikwizard.com/photo/monitors-displaying-financial-charts-in-modern-office-setting/b45c2c7b4ce09b31e8acbbaf17c6eda0/"
style="text-decoration: none; font-size: 10px; margin: 0;"
>
<img src="https://pikwizard.com/pw/medium/b45c2c7b4ce09b31e8acbbaf17c6eda0.jpg" style="margin: 0; width: 100%;" alt="" />
<p style="font-size: 12px; margin: 0;">PikWizard</p>
</a>
</span>
</span>
Free (free of charge)
Free for personal and commercial use.
Author: AI Creator
Similar Free Stock Images

Premium


Premium


Premium


Premium

Premium

Premium


Premium


Premium


Premium


Premium


Premium


Premium


Premium


Premium


Premium


Premium


Premium


Premium


Premium


Premium


Premium


Premium

Premium

Premium