- Home >
- Stock Photos >
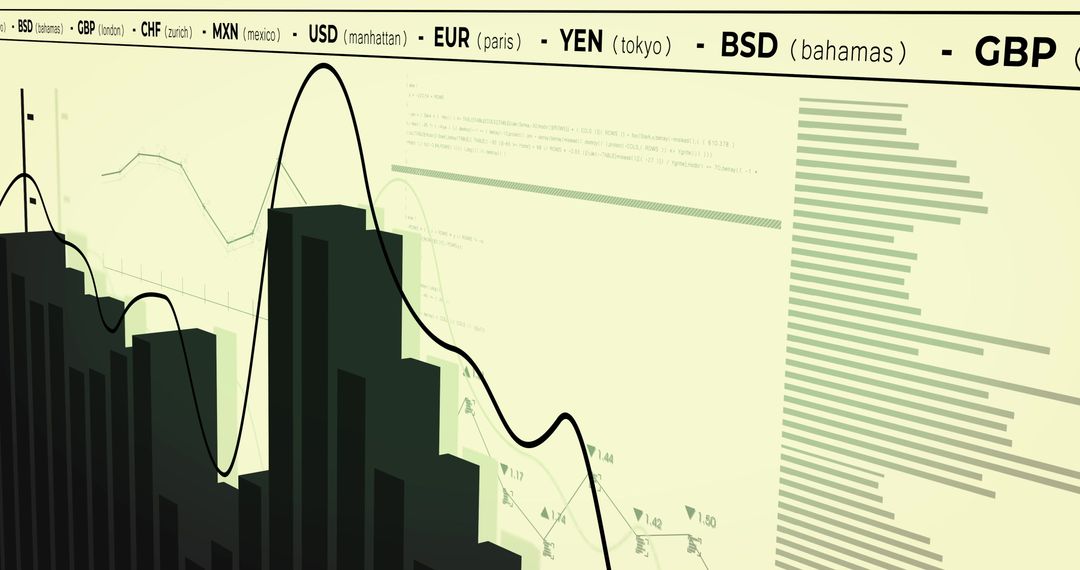
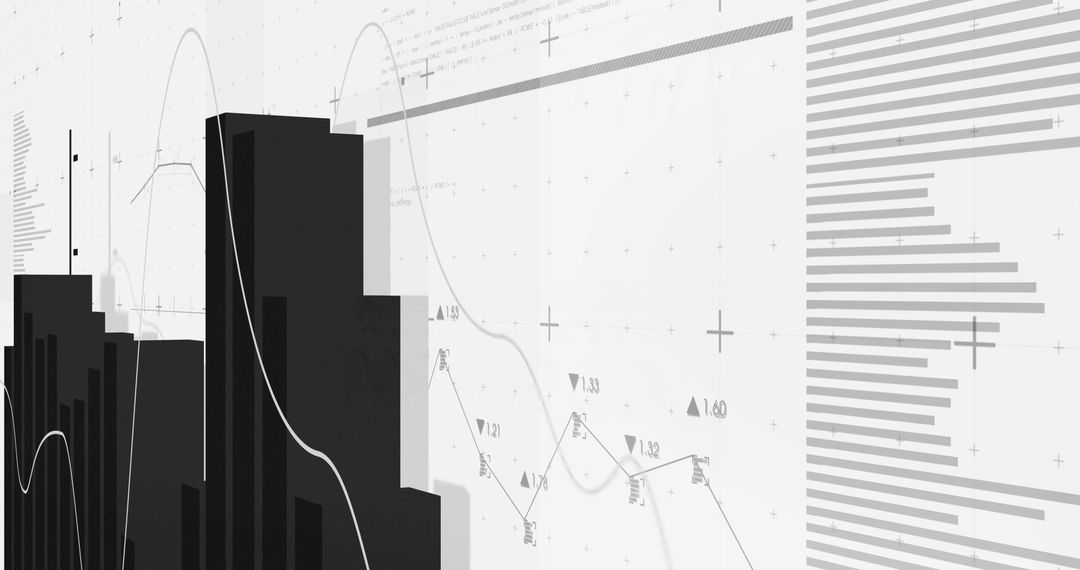
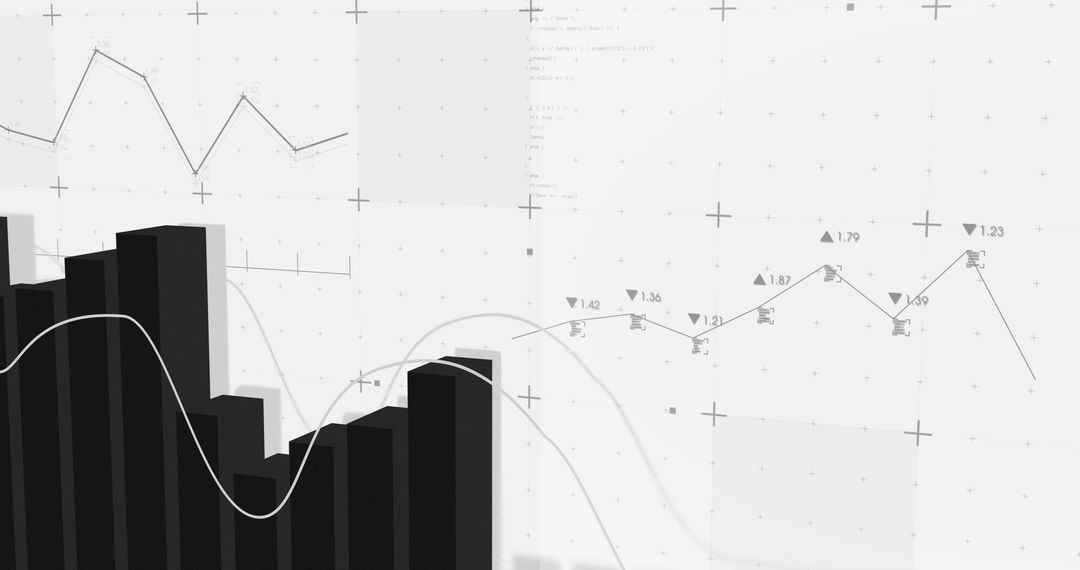
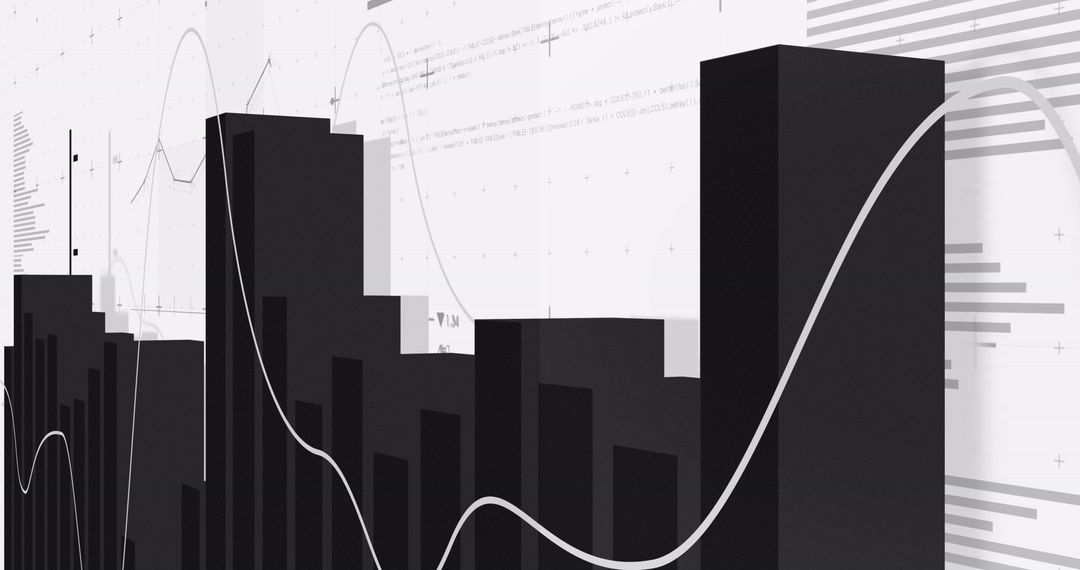
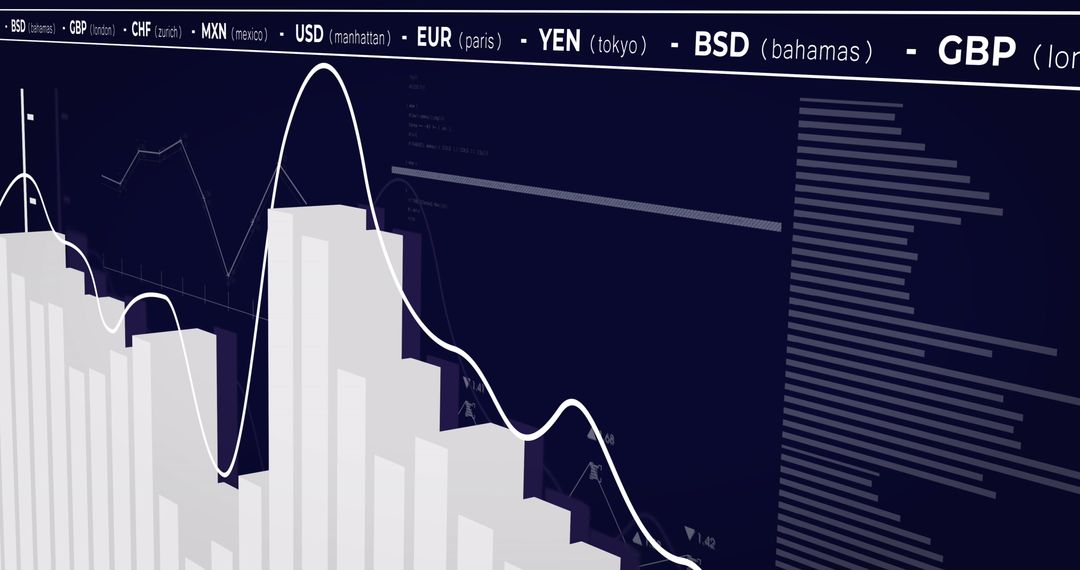
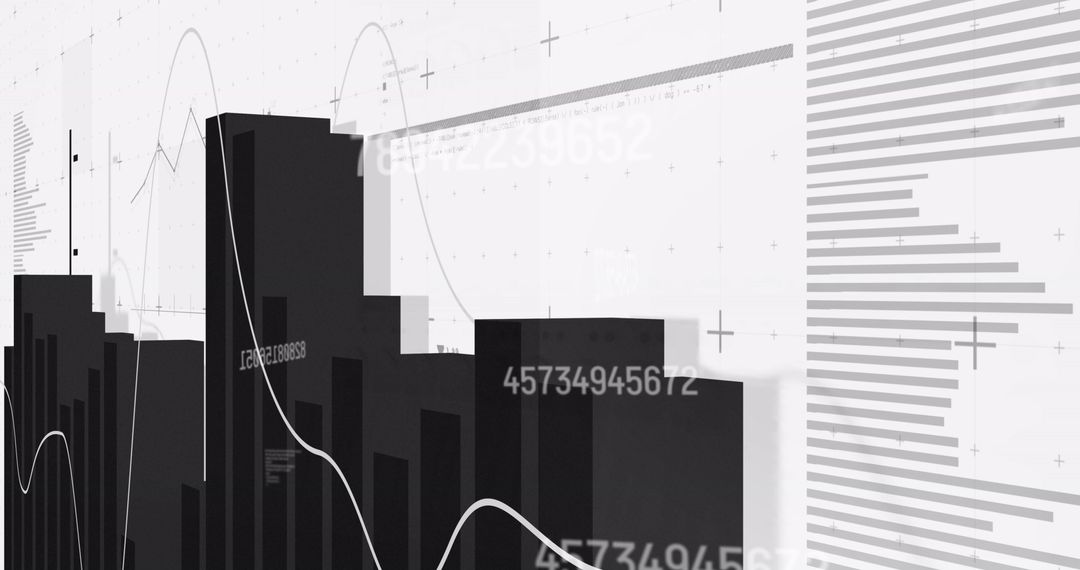
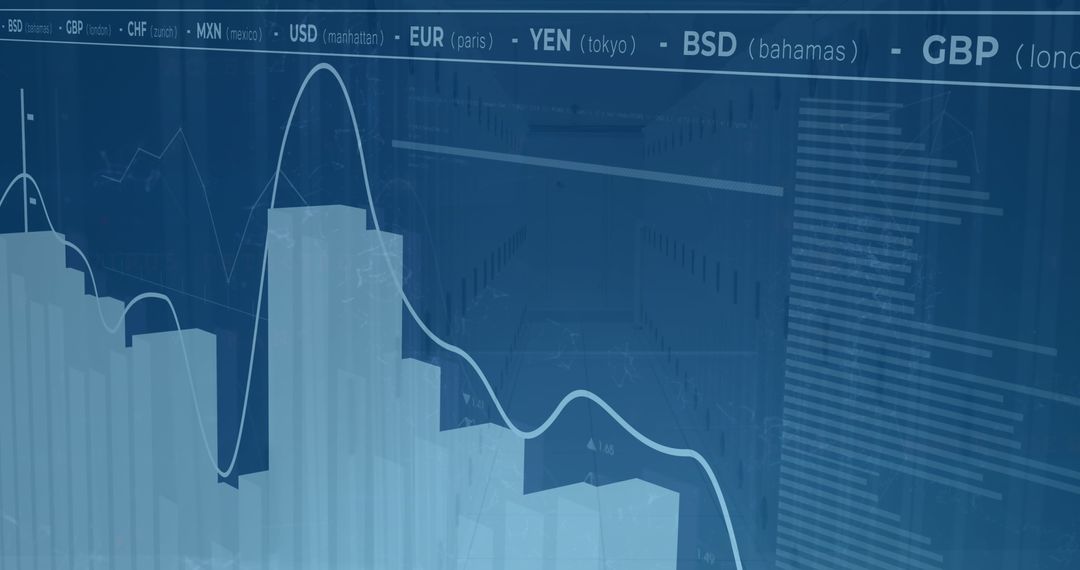
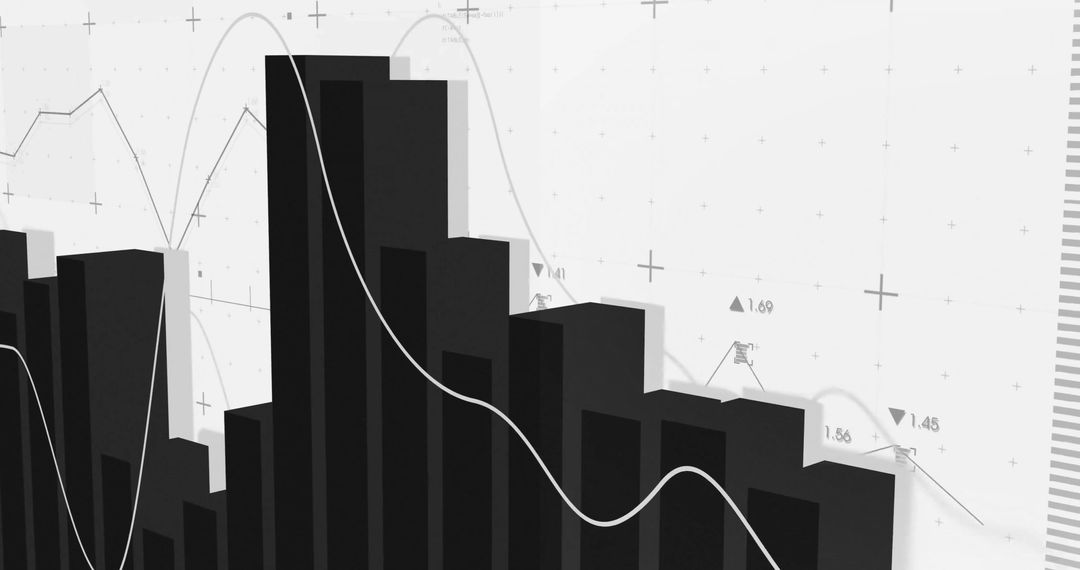
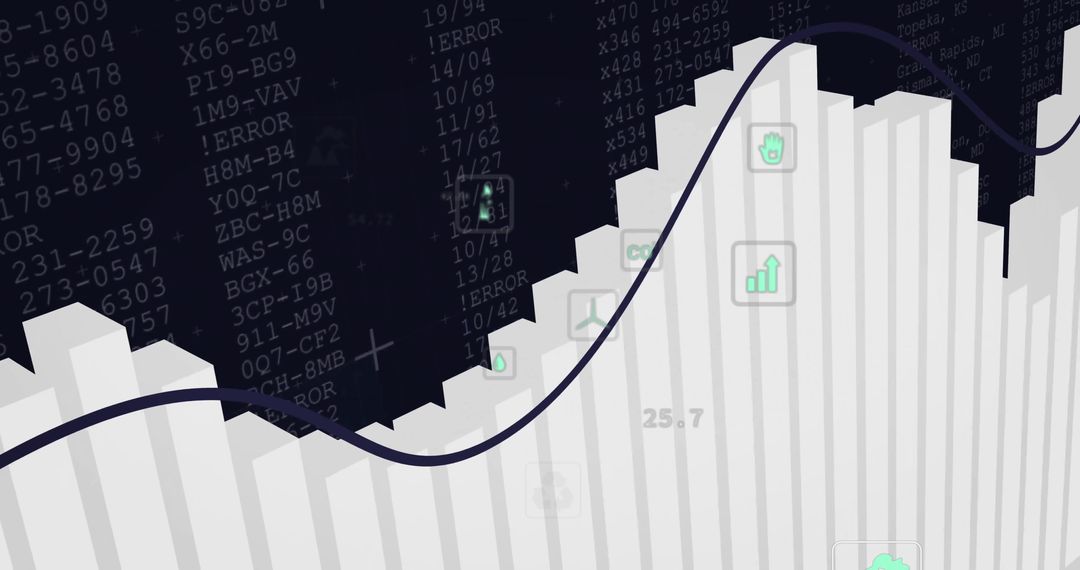
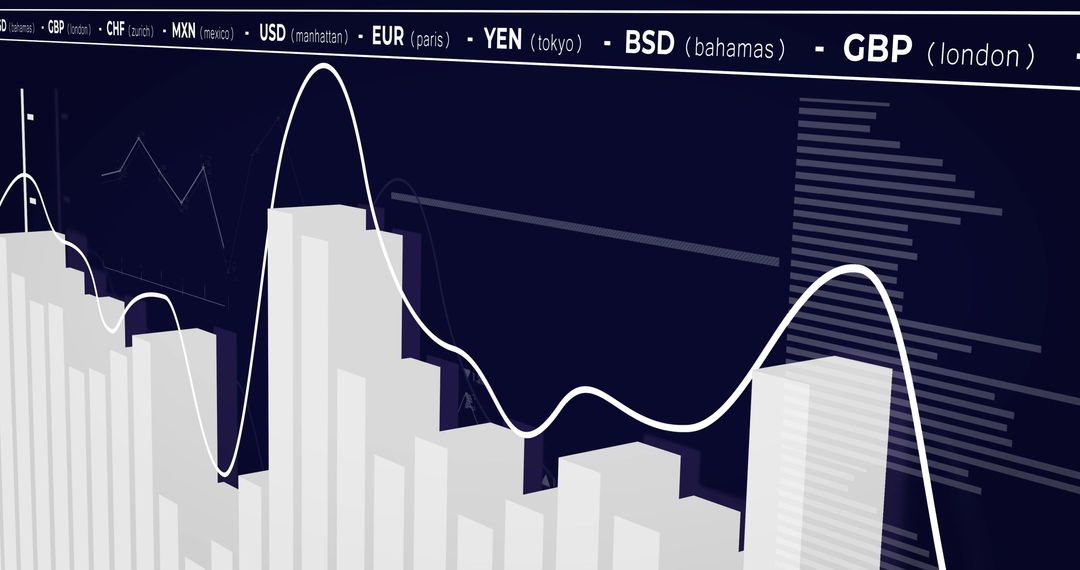
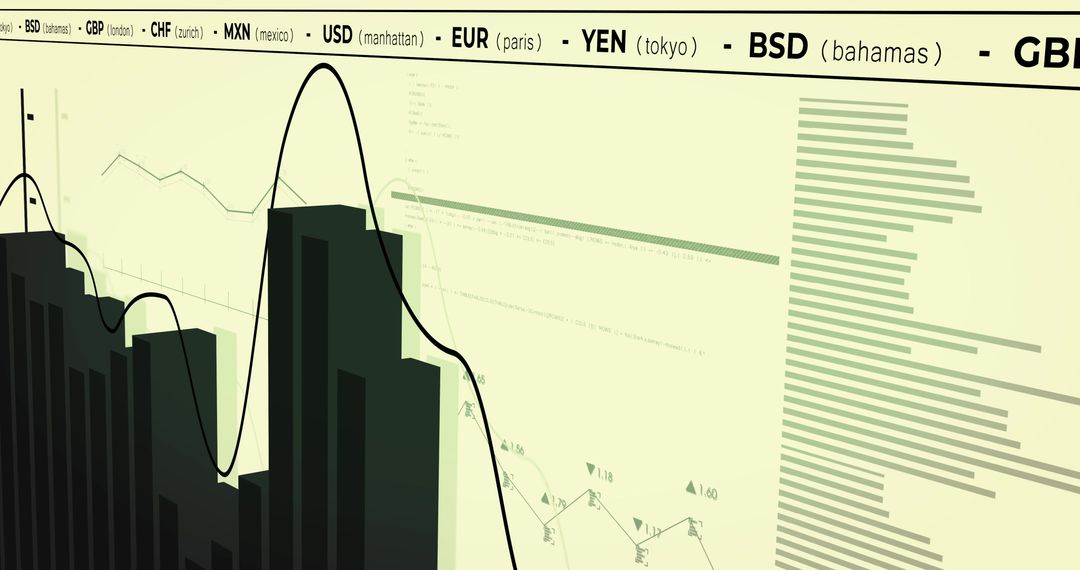
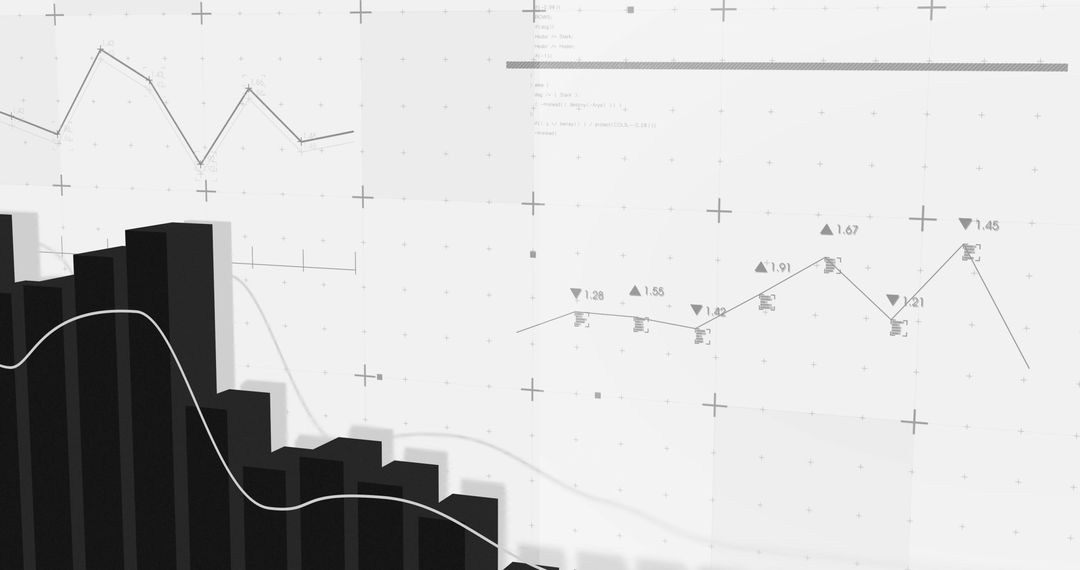
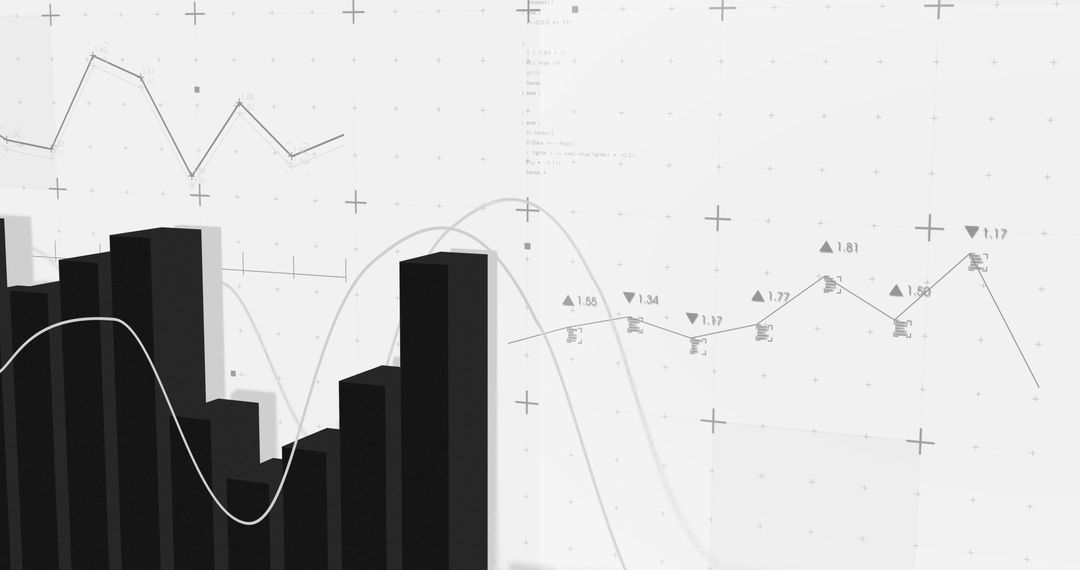
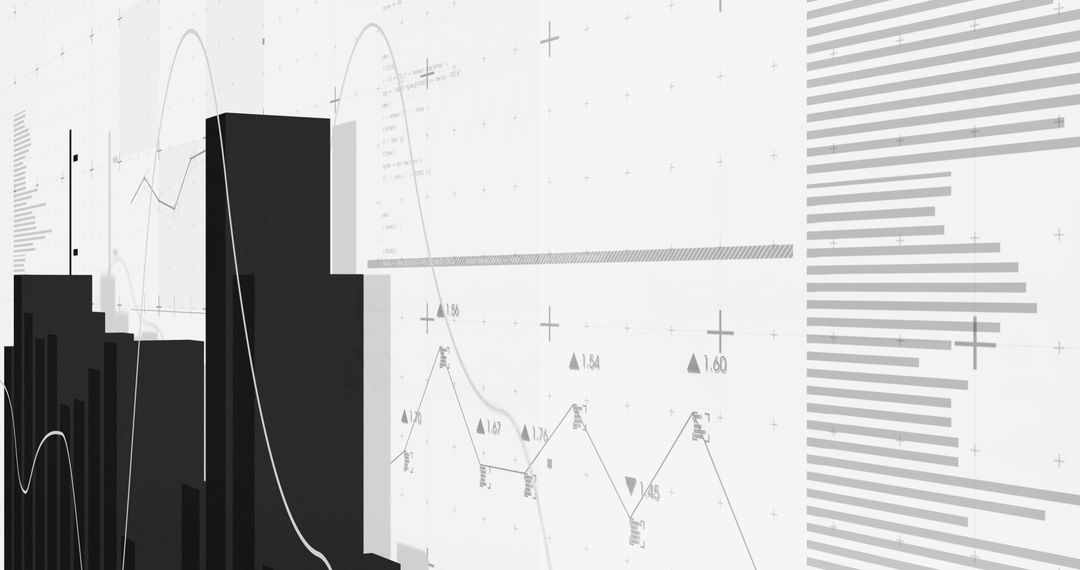
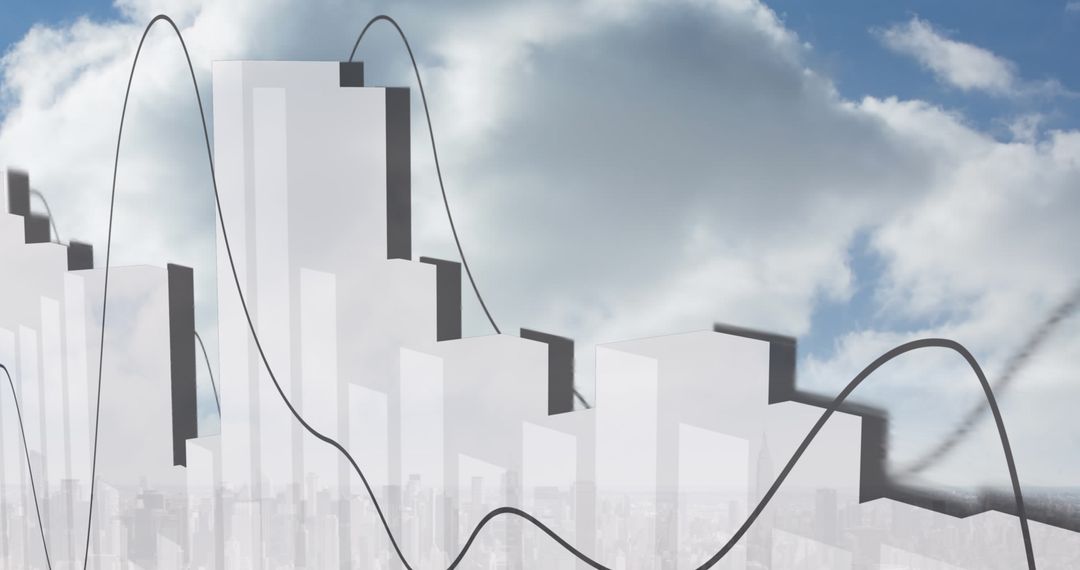
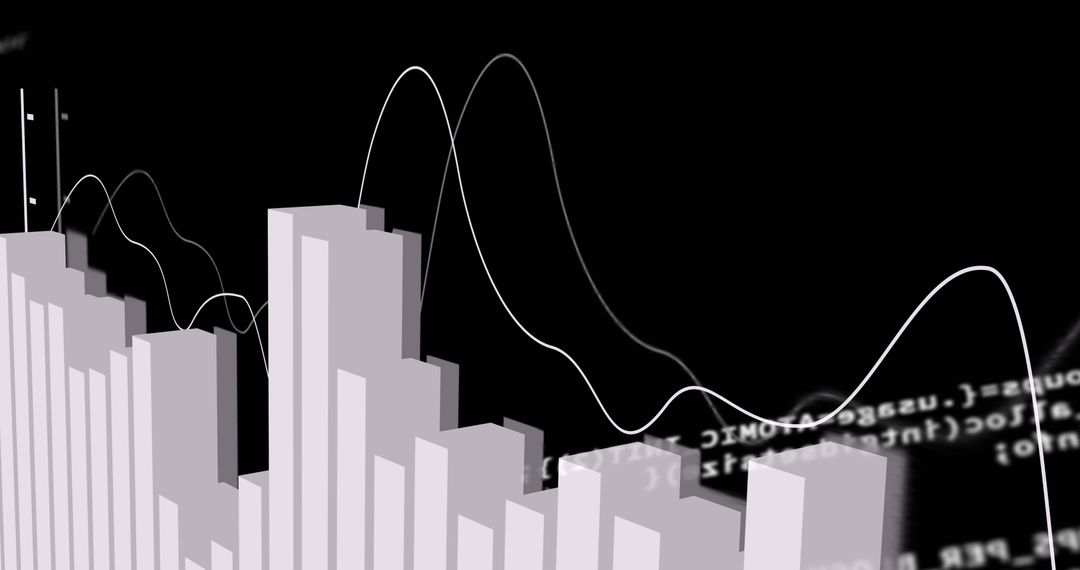
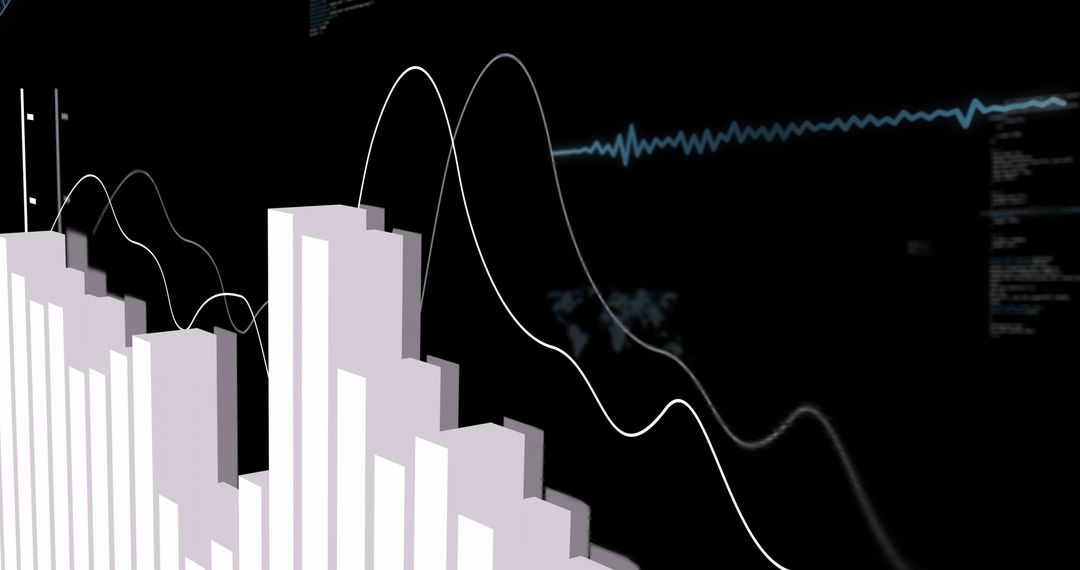
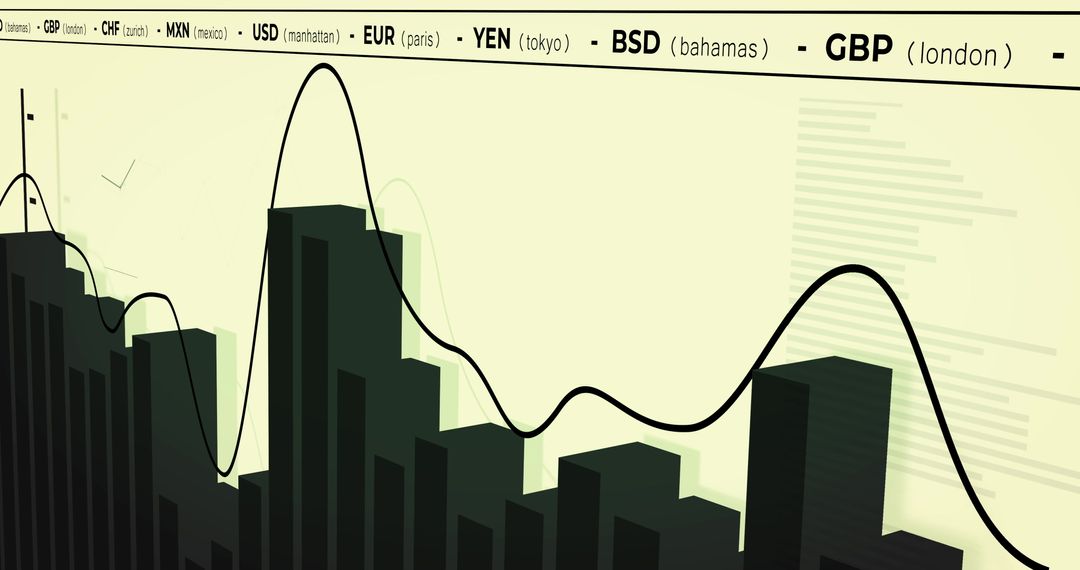
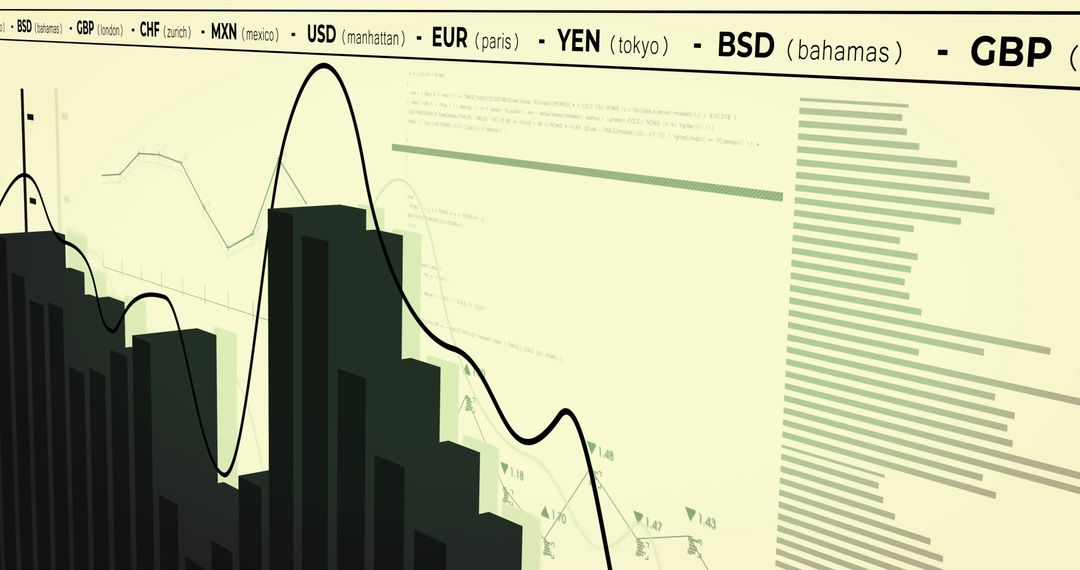
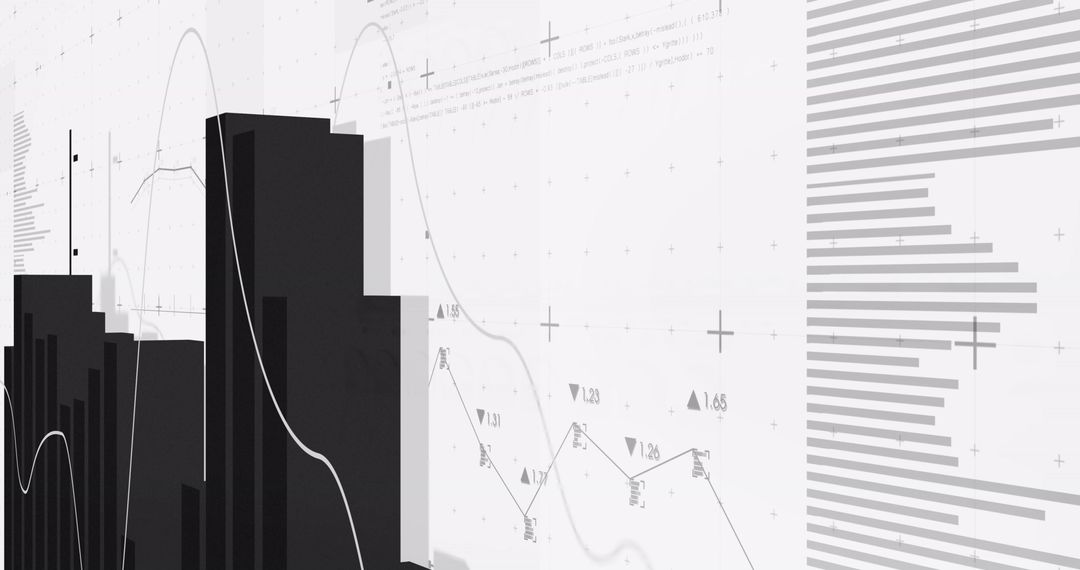
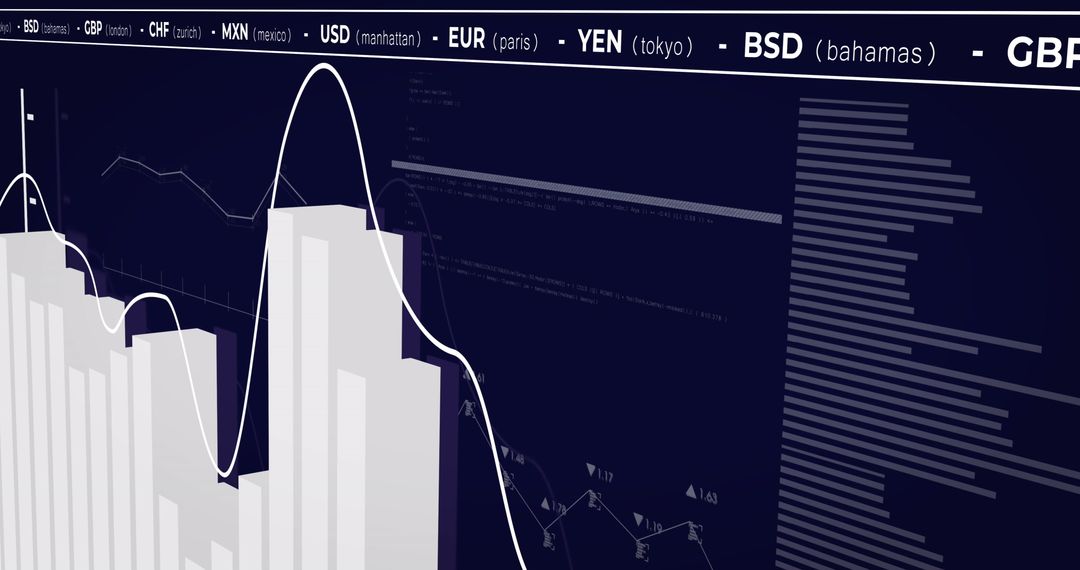
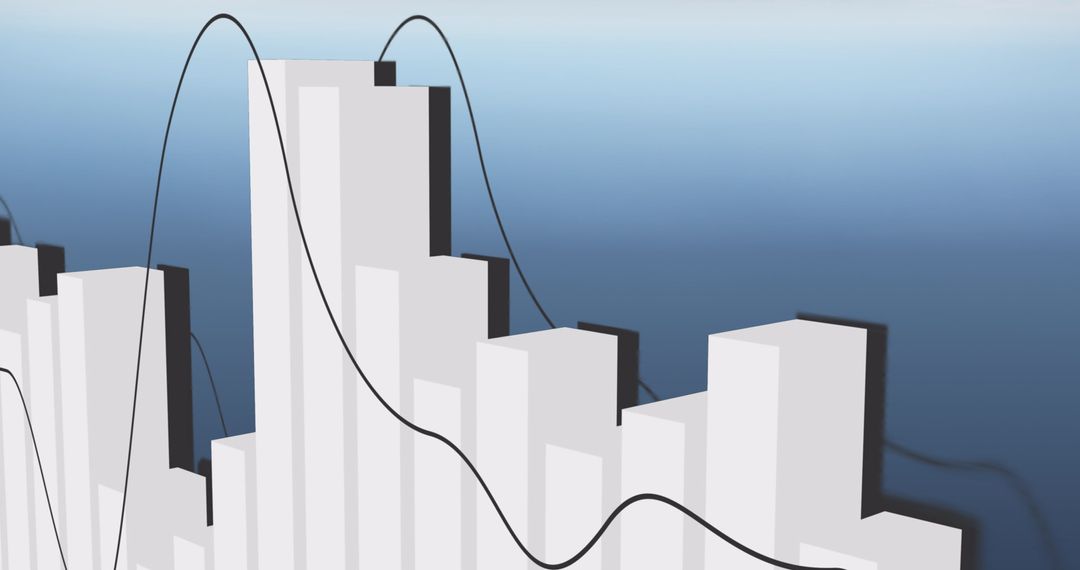
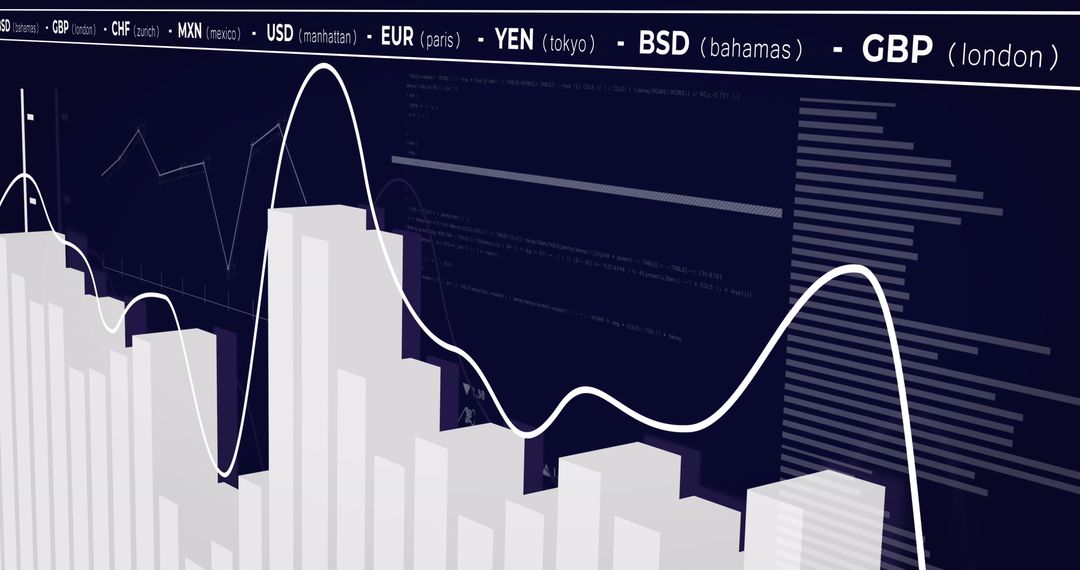
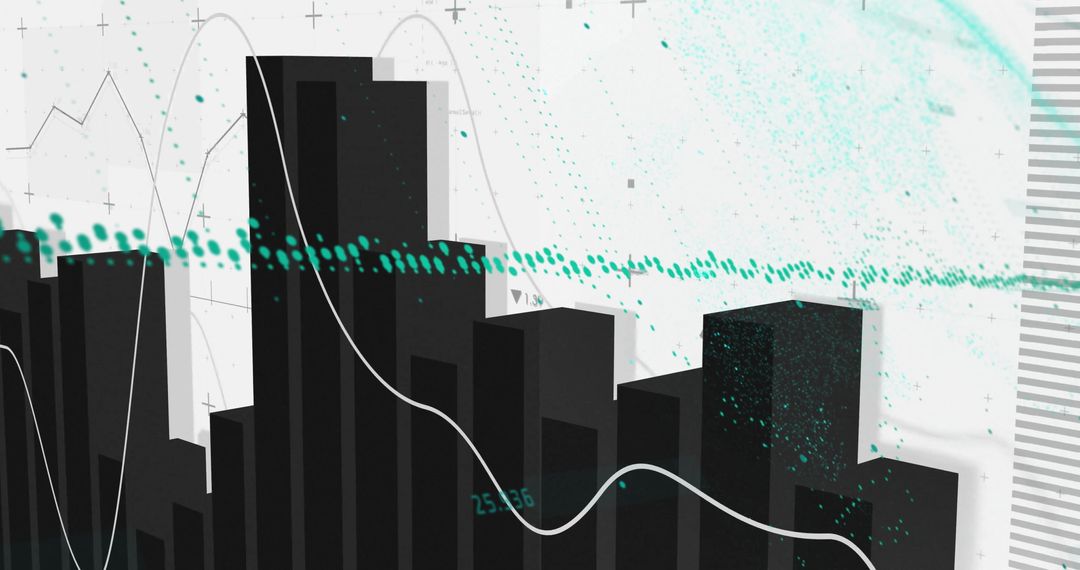
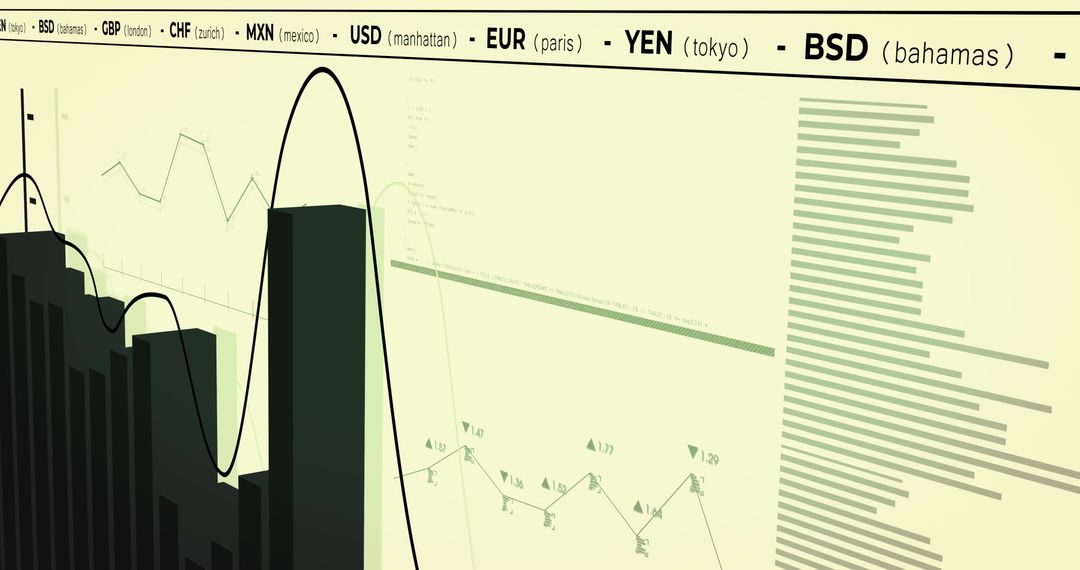
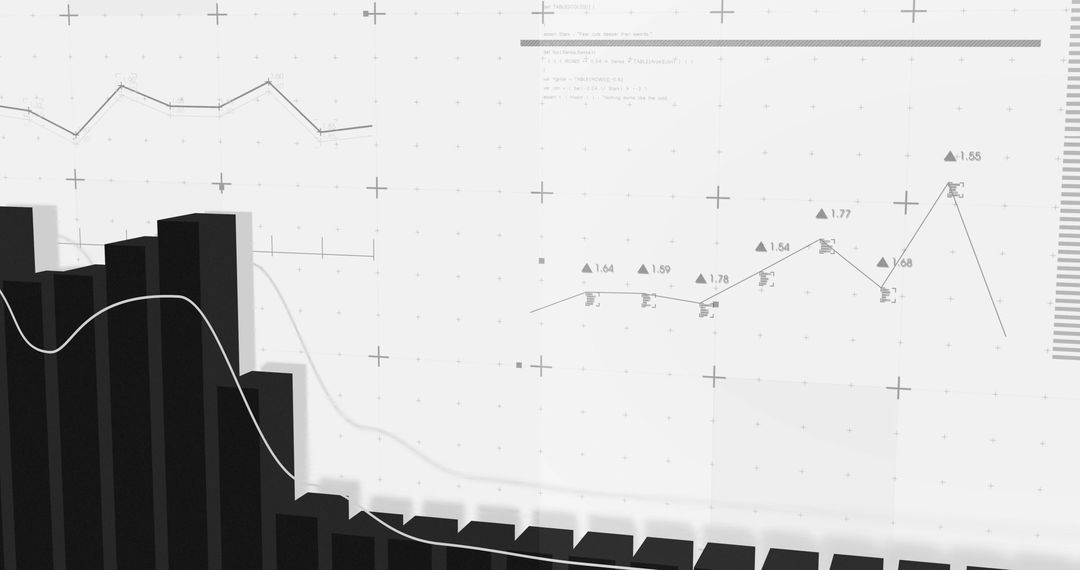
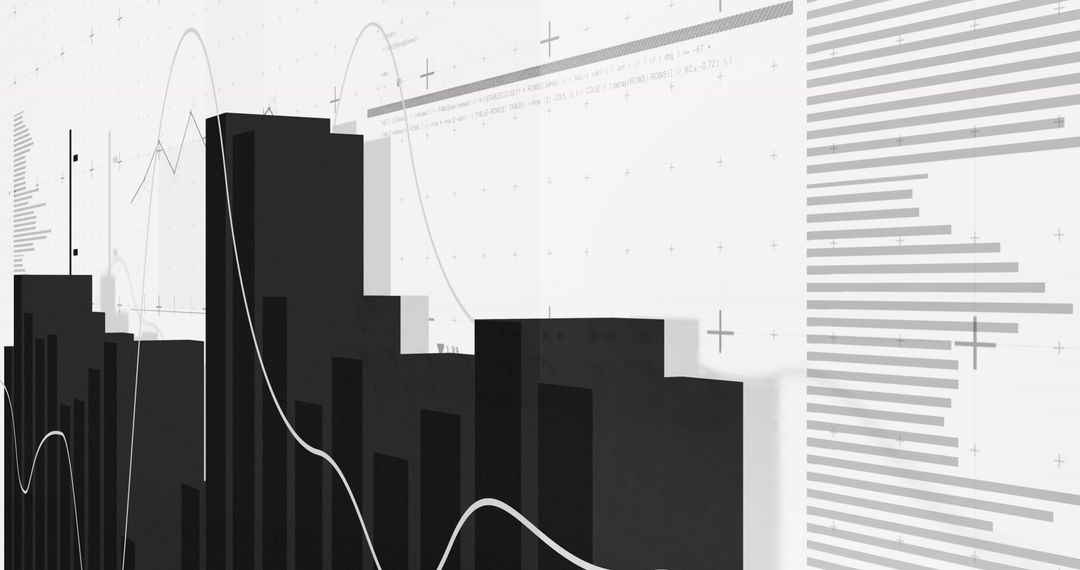
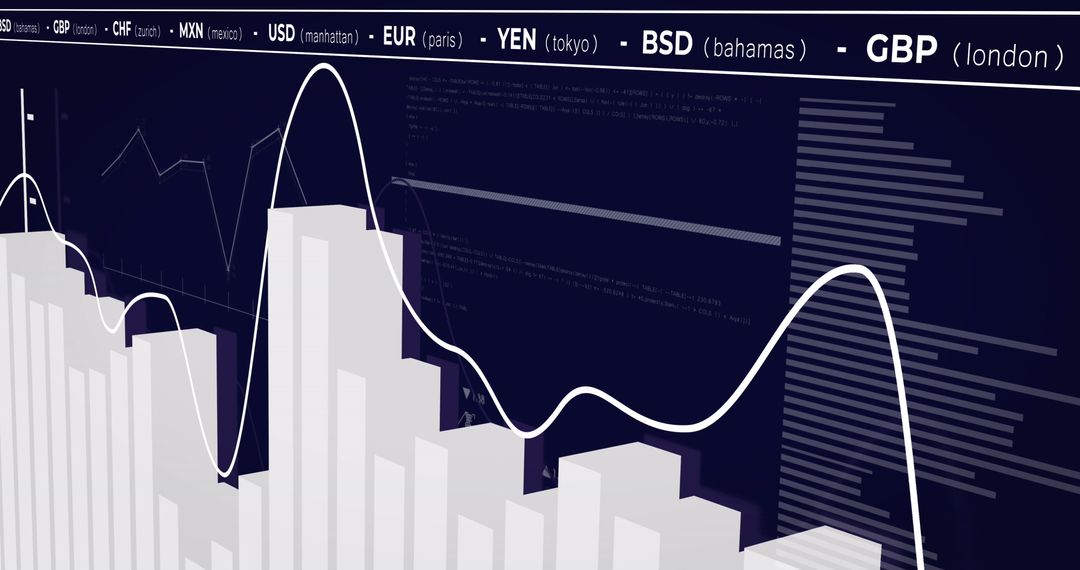
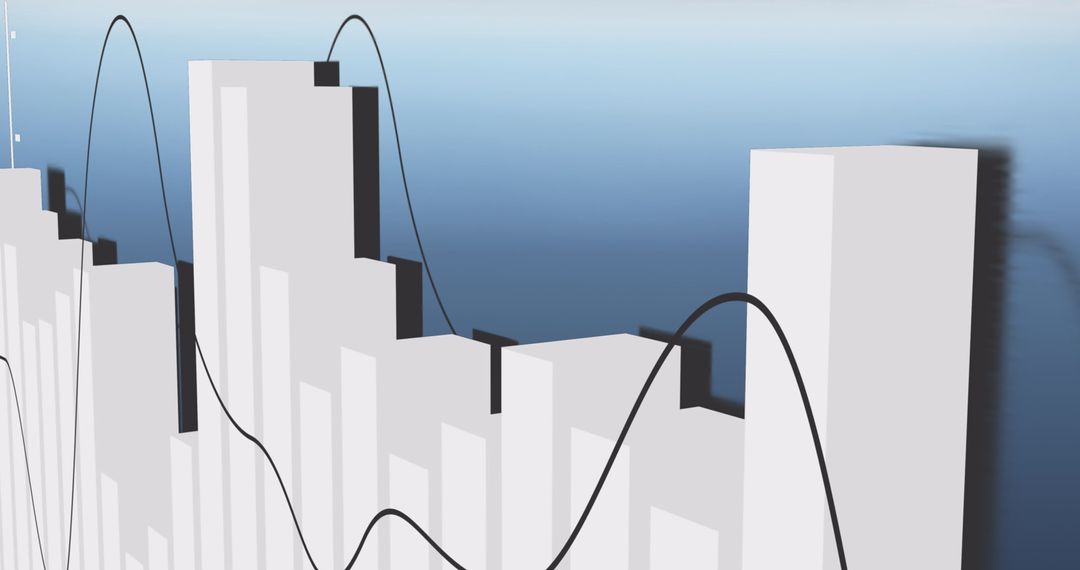
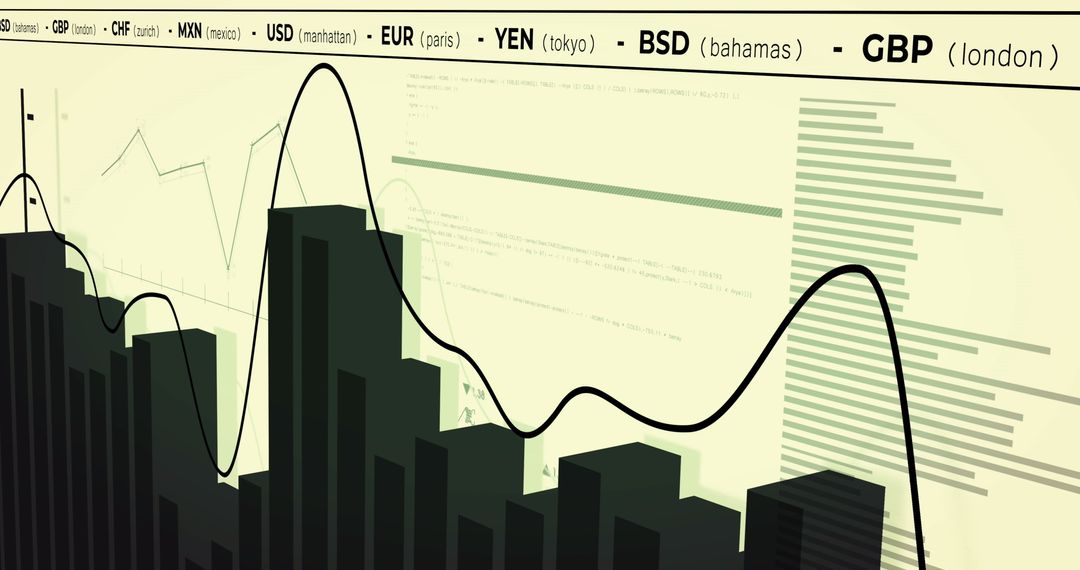
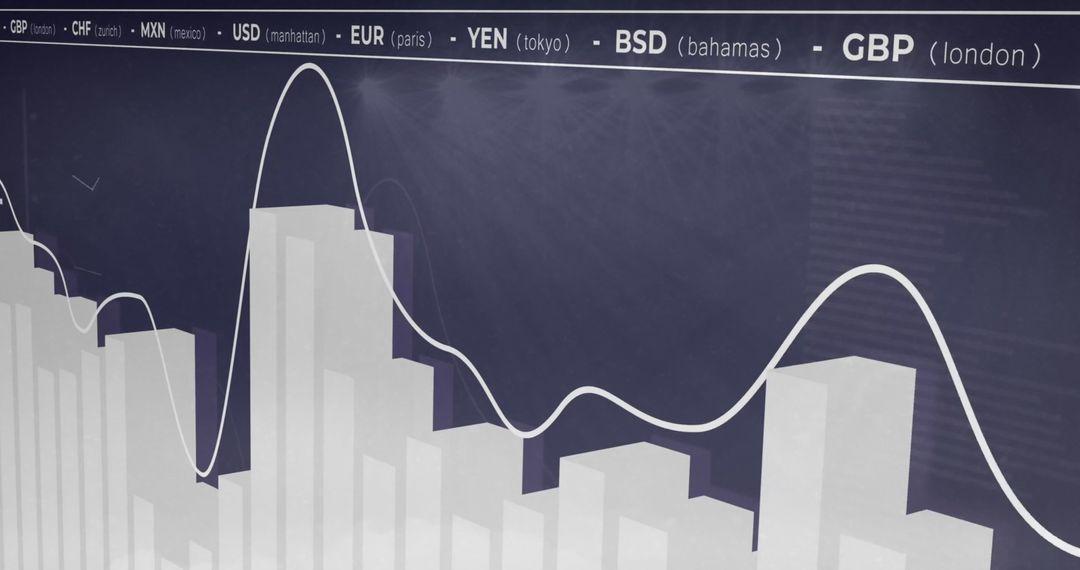
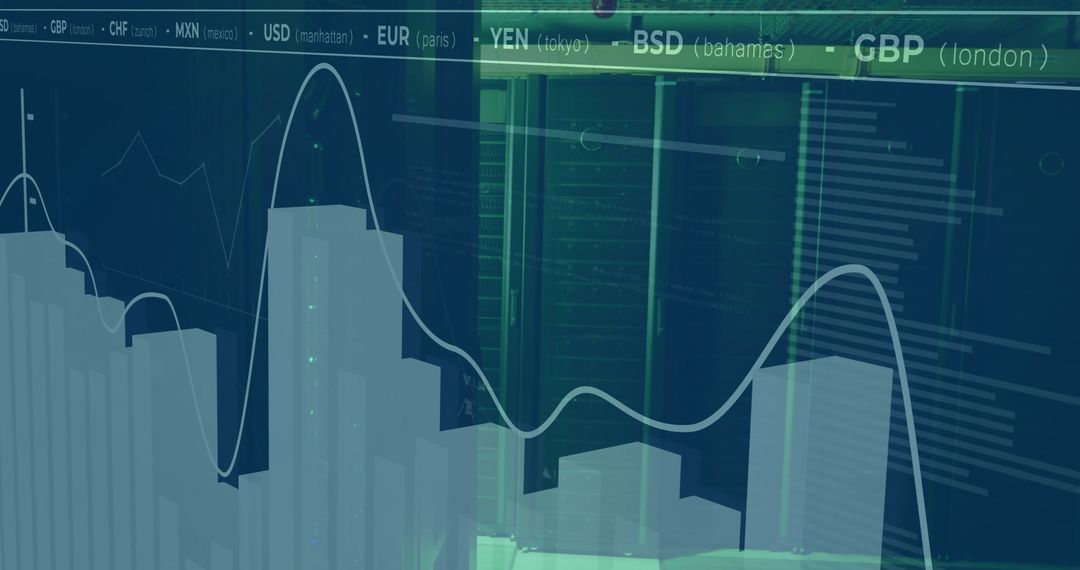
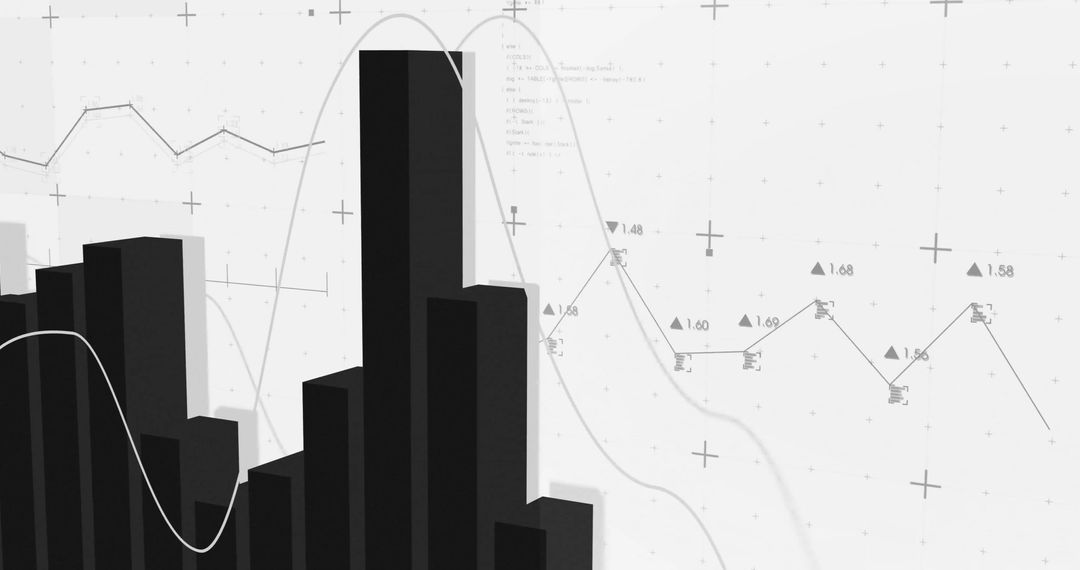
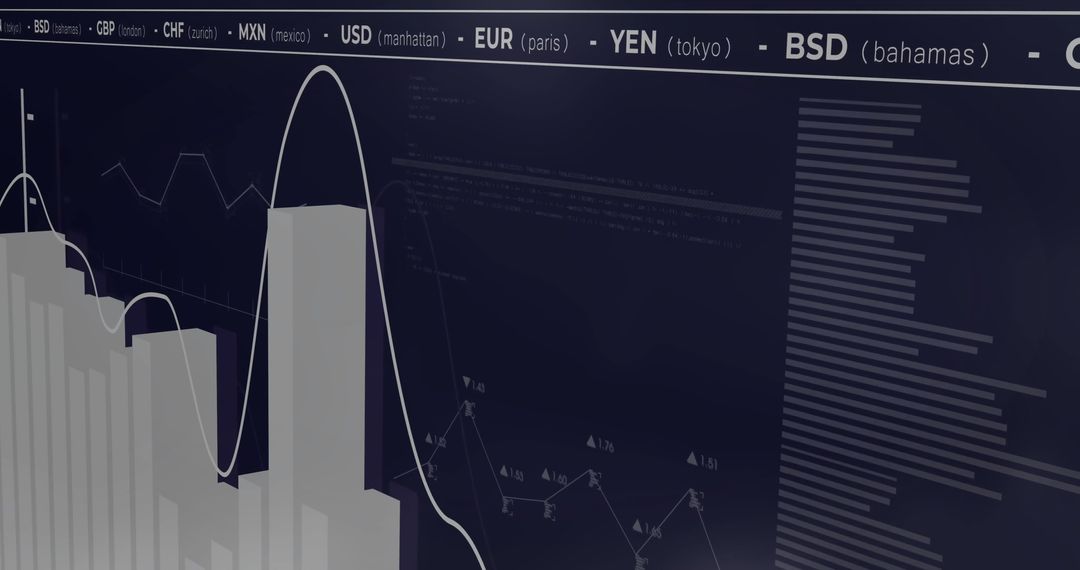
- Monochrome 3D Bar Chart Showing Financial Analytics with Overlaid Line Trend and Grid Marks
Monochrome 3D Bar Chart Showing Financial Analytics with Overlaid Line Trend and Grid Marks Image

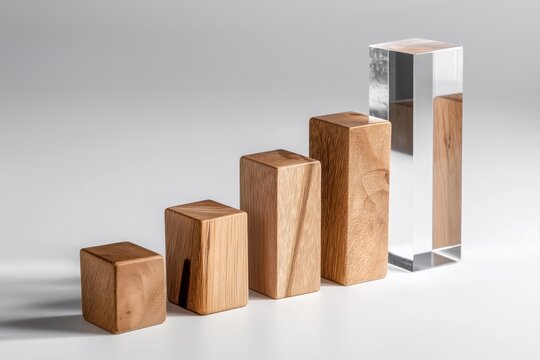
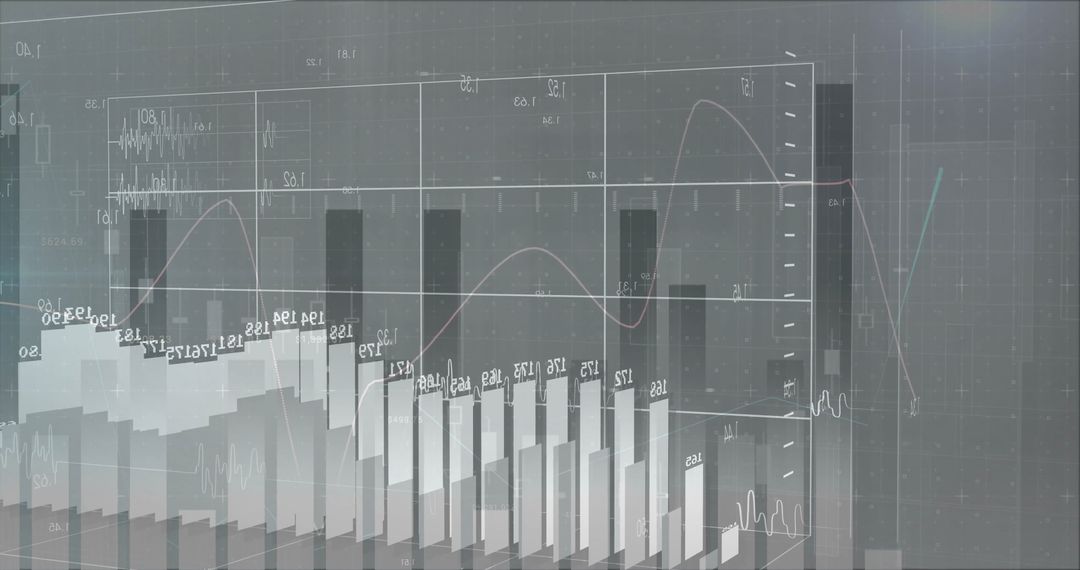
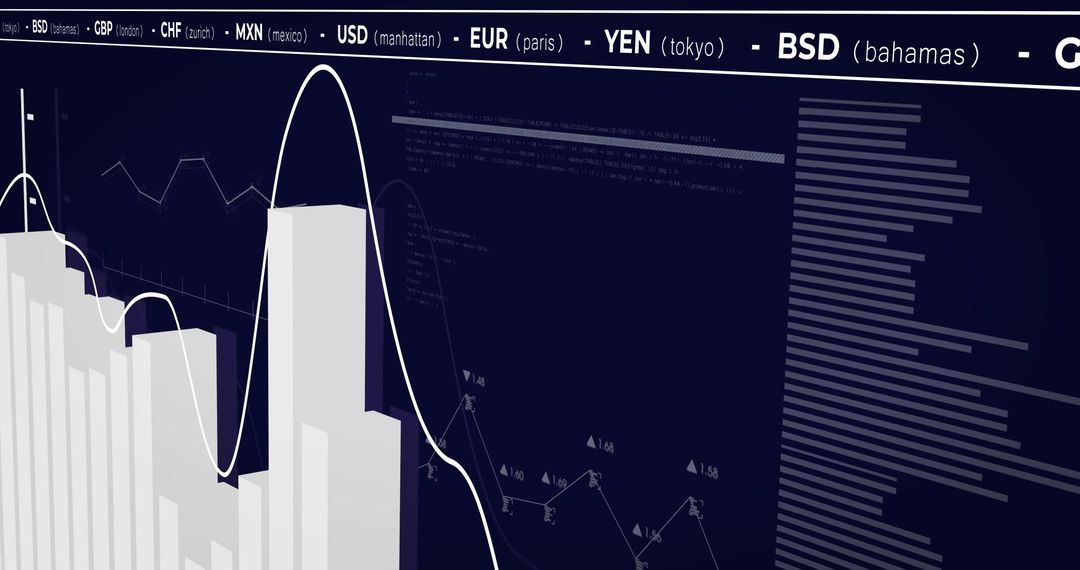
Ideal for presenting quarterly revenue and sales trends, illustrating market analysis, decorating corporate report covers, designing website hero banners and landing pages, and serving as background for slide decks and investor pitch decks. Clean monochrome composition supporting overlaying of colored highlights, text, and data callouts for clear storytelling. Strong geometric forms creating modern, minimalist mood suited for fintech, corporate, and editorial projects. Recommended cropping for widescreen layouts and adding brand colors or annotations to emphasize key metrics and trends.
Powered by 


0
downloads
downloads
Tags:
More
Credit Photo
If you would like to credit the Photo, here are some ways you can do so
Text Link
photo Link
<span class="text-link">
<span>
<a target="_blank" href=https://pikwizard.com/photo/monochrome-3d-bar-chart-showing-financial-analytics-with-overlaid-line-trend-and-grid-marks/07f05cf31c8286f3a5c7f953db749229/>PikWizard</a>
</span>
</span>
<span class="image-link">
<span
style="margin: 0 0 20px 0; display: inline-block; vertical-align: middle; width: 100%;"
>
<a
target="_blank"
href="https://pikwizard.com/photo/monochrome-3d-bar-chart-showing-financial-analytics-with-overlaid-line-trend-and-grid-marks/07f05cf31c8286f3a5c7f953db749229/"
style="text-decoration: none; font-size: 10px; margin: 0;"
>
<img src="https://pikwizard.com/pw/medium/07f05cf31c8286f3a5c7f953db749229.jpg" style="margin: 0; width: 100%;" alt="" />
<p style="font-size: 12px; margin: 0;">PikWizard</p>
</a>
</span>
</span>
Free (free of charge)
Free for personal and commercial use.
Author: Awesome Content
Similar Free Stock Images

Premium


Premium


Premium


Premium


Premium


Premium


Premium


Premium


Premium


Premium


Premium


Premium


Premium


Premium


Premium


Premium


Premium


Premium


Premium


Premium


Premium


Premium


Premium


Premium