- Home >
- Stock Photos >
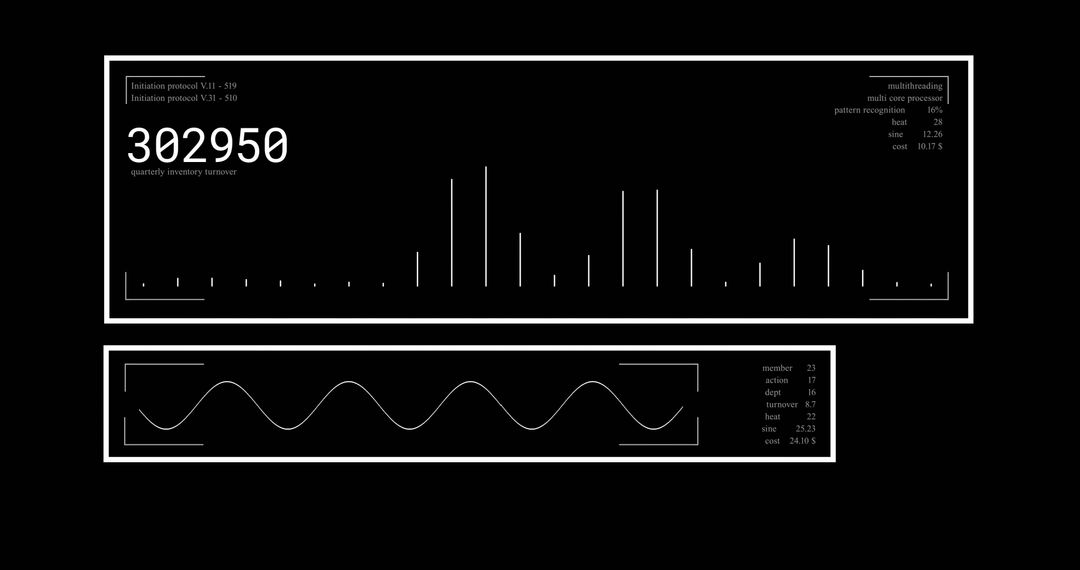
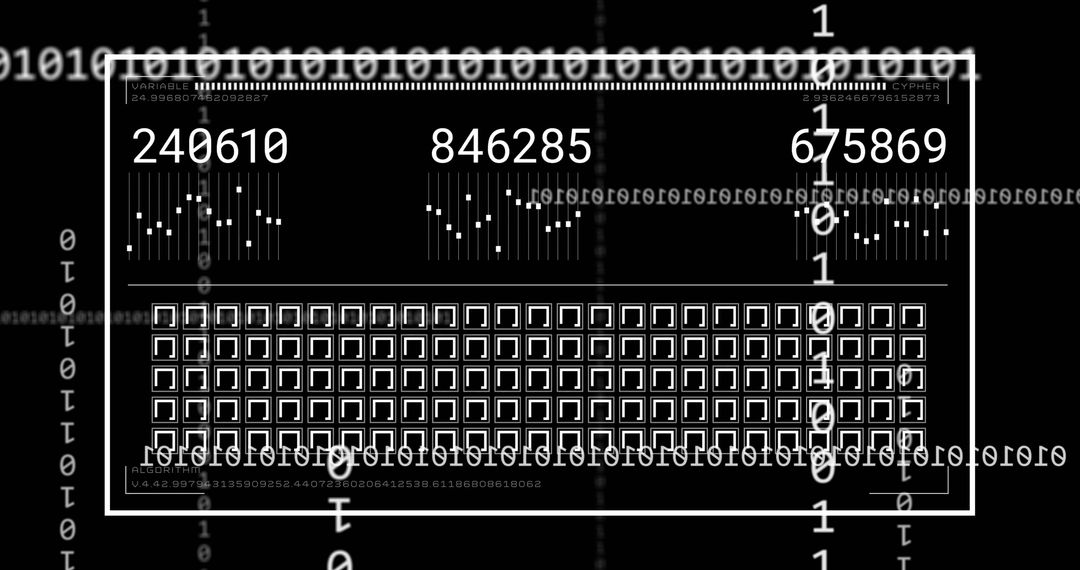
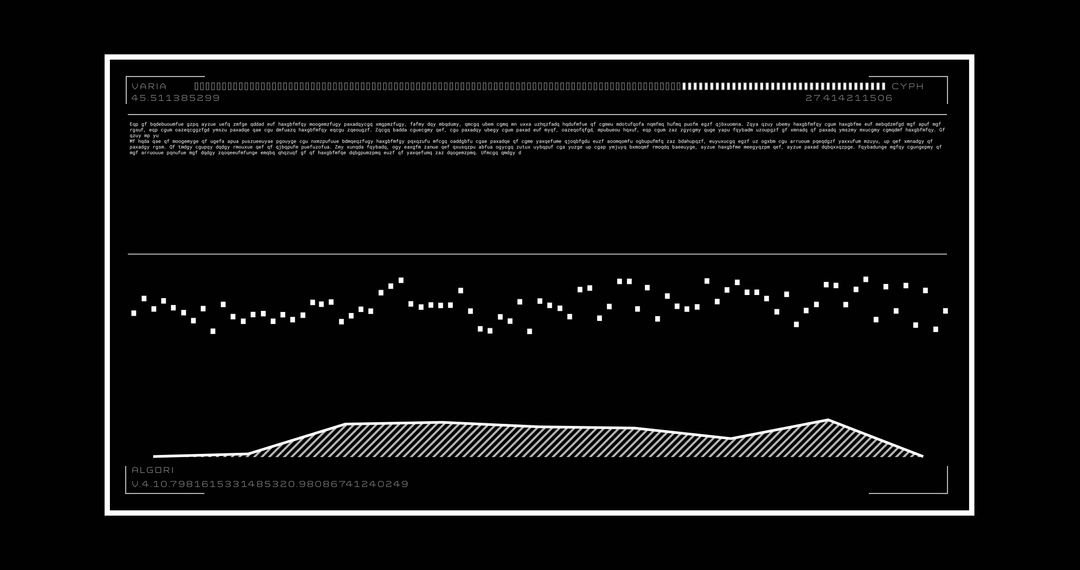
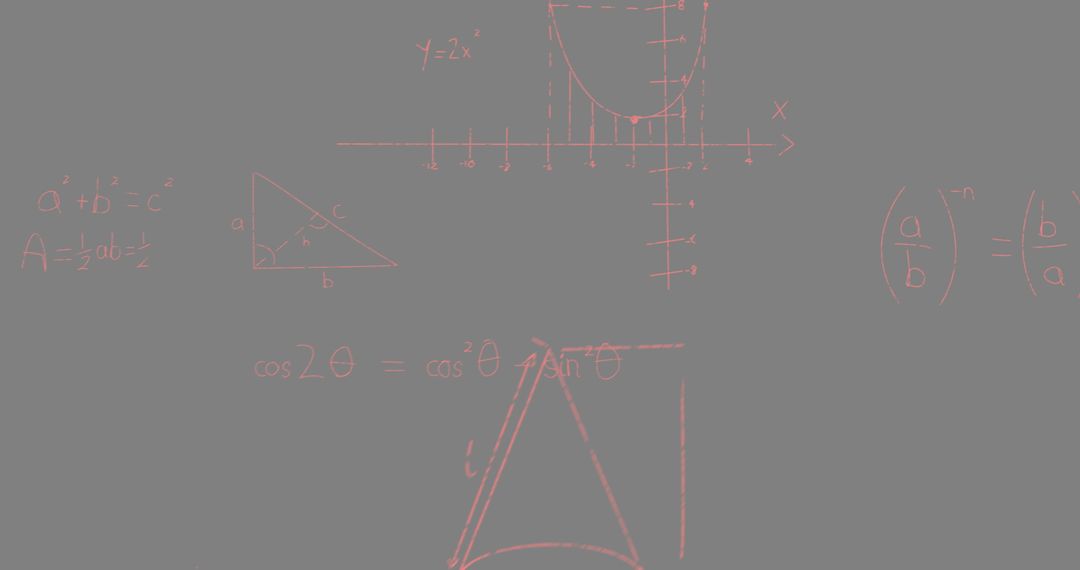
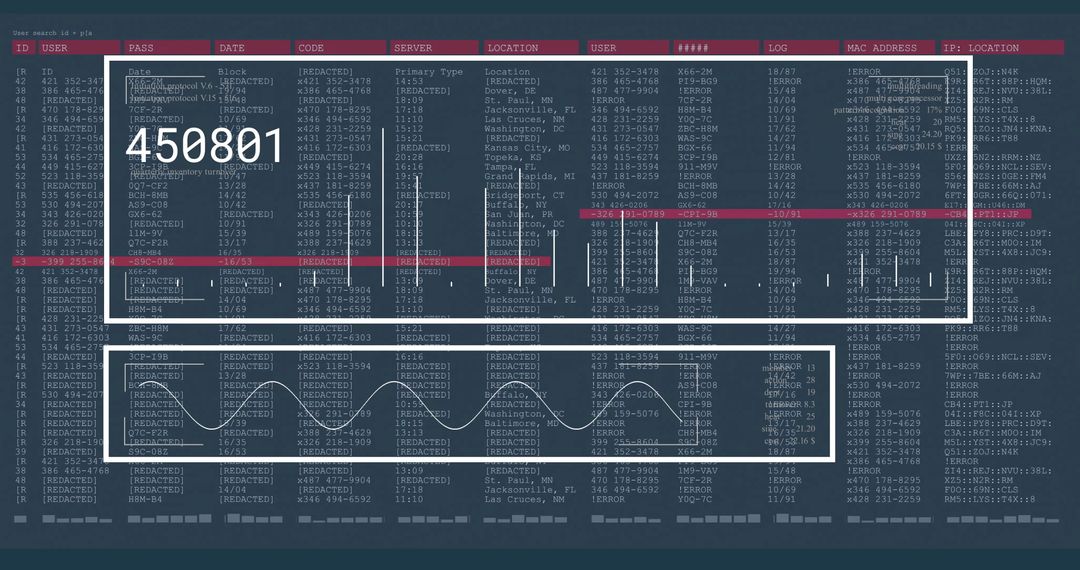
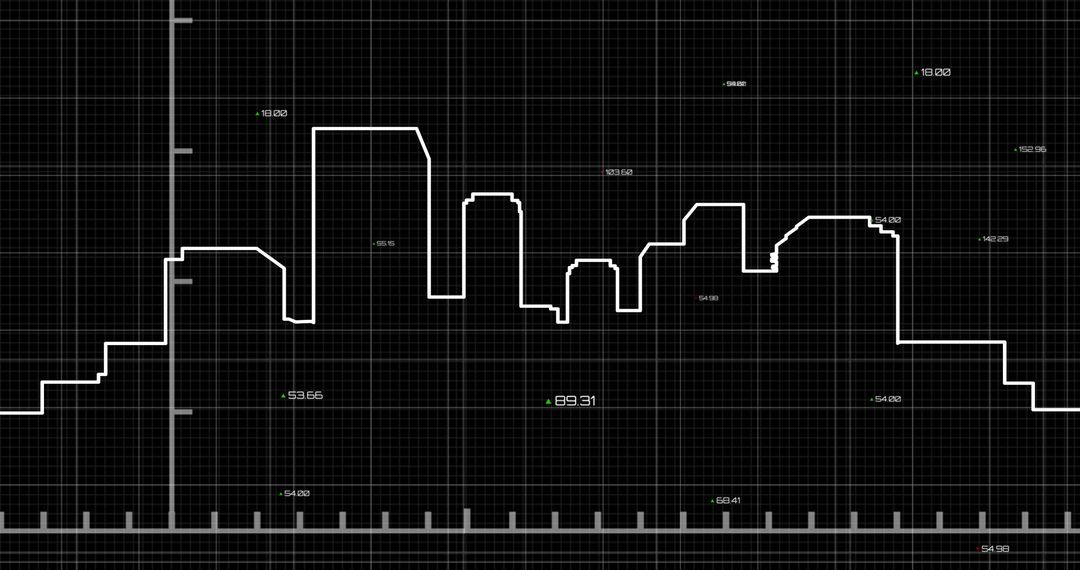
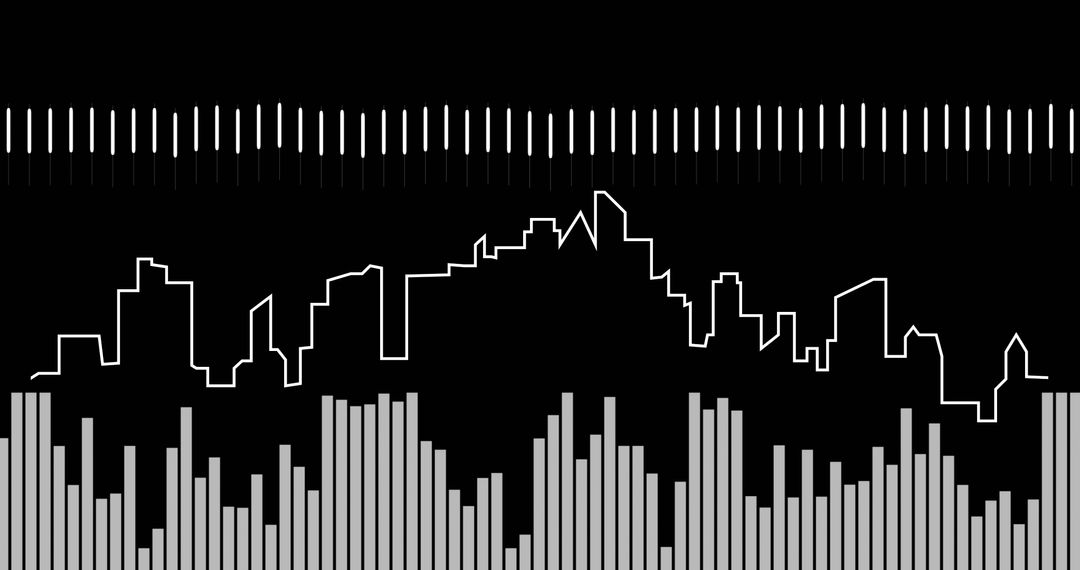
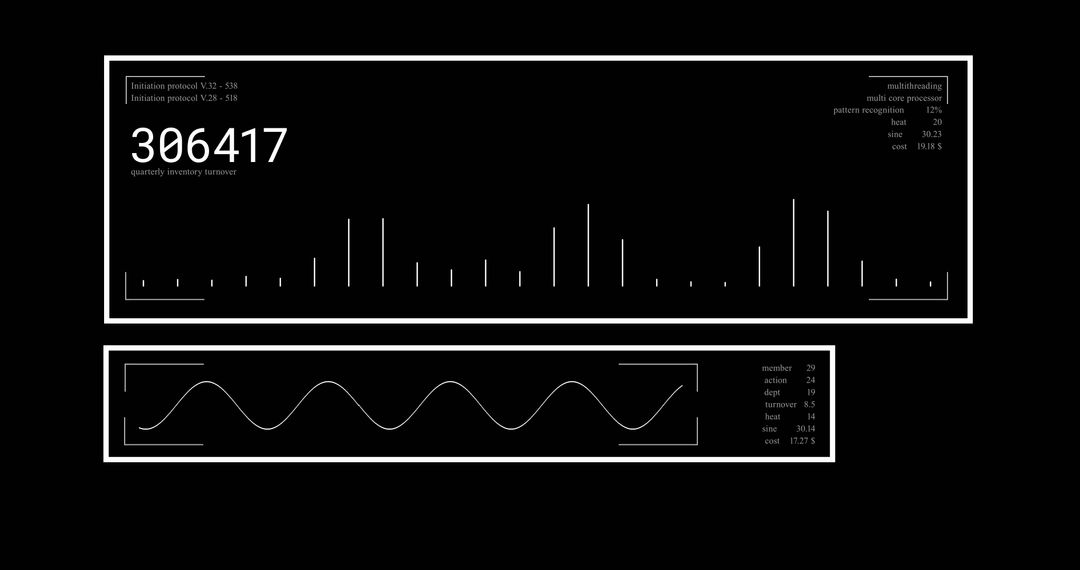
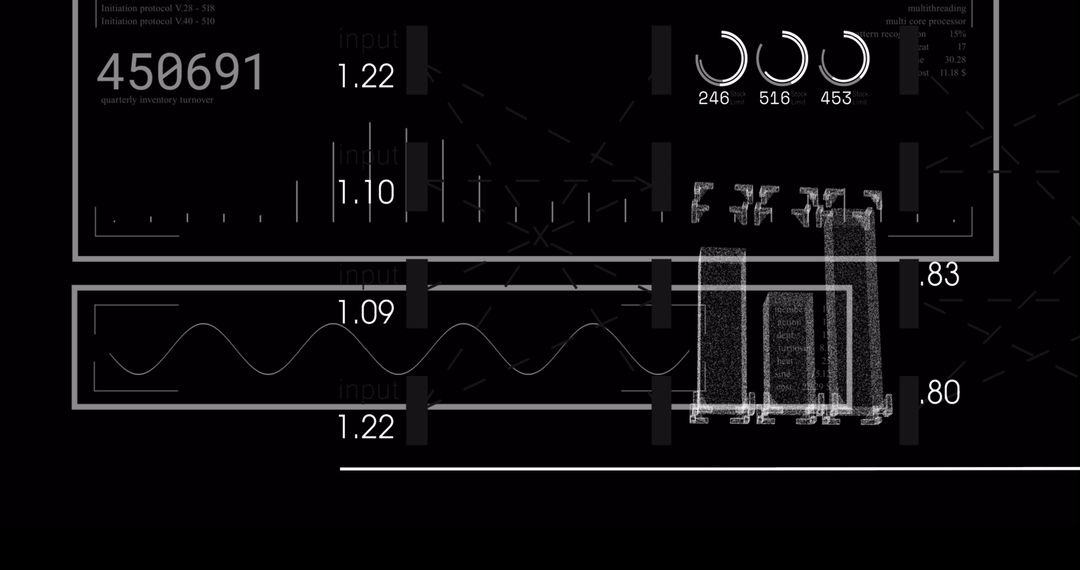
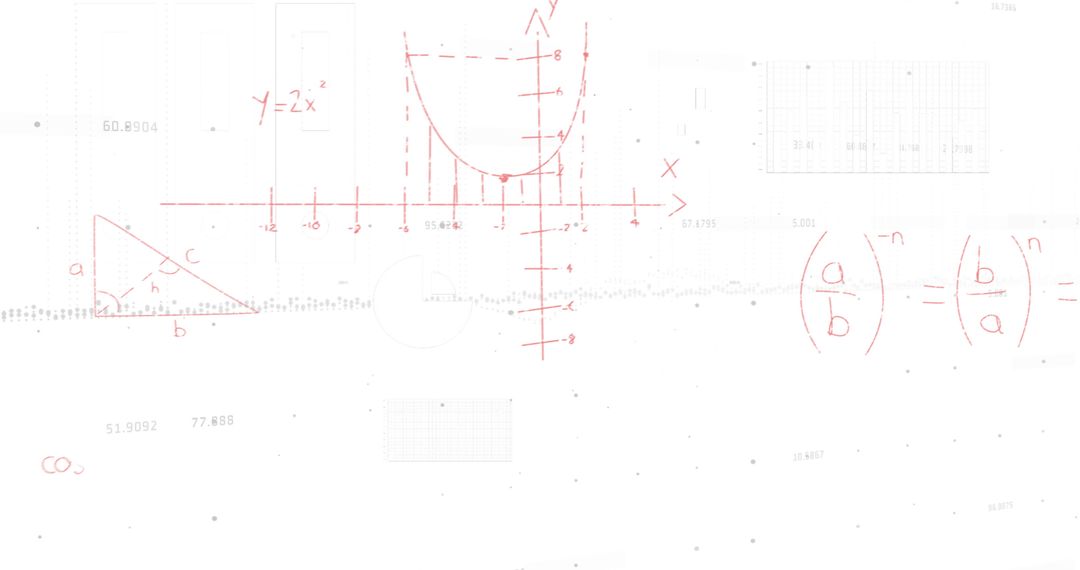
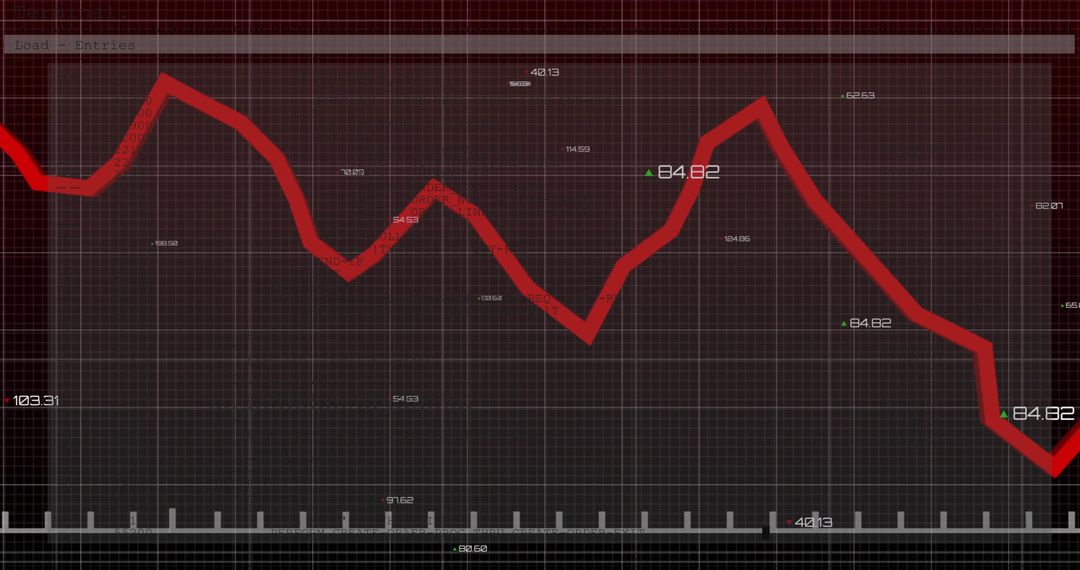
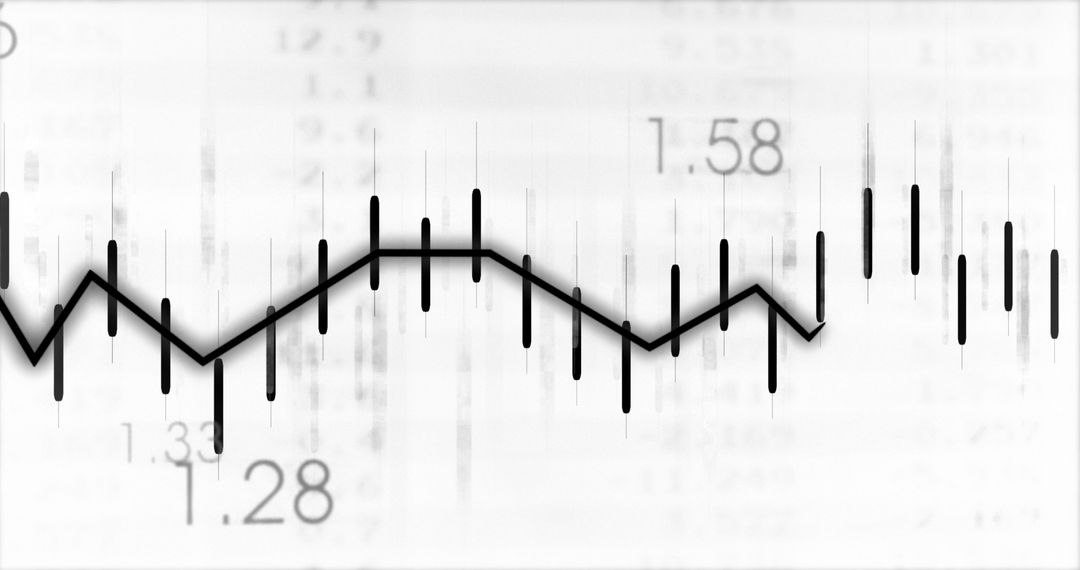
- Monochrome Dashboard Displaying Large Numeric Metric, Waveform Chart, Tick Markers and Formulas
Monochrome Dashboard Displaying Large Numeric Metric, Waveform Chart, Tick Markers and Formulas Image
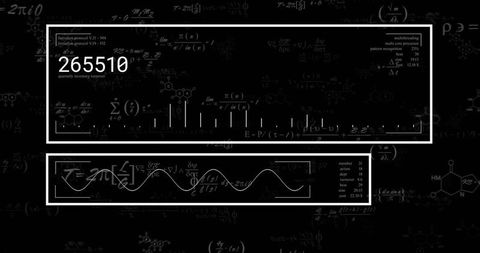
High contrast monochrome composition showing two centered data panels on blackboard-like backdrop, containing large numeric metric 265510, waveform graph, tick markers, and faint scientific formulas. Clean framed panels and thin white lines creating schematic UI feel suitable for modern tech and science projects. Suiting website hero banners, presentation slides, editorial spreads, app concept mockups, marketing materials, educational resources, and finance dashboards. Supporting color customization and cropping for headers, social posts, background overlays, or printed collateral. Suggesting edits such as replacing numeric value with custom KPI, animating waveform for video intros, overlaying brand logo and headline, or combining with bold typography for data-driven storytelling.
Powered by  - Get 15% off with code: PIKWIZARD15


0
downloads
downloads
Tags:
More
Credit Photo
If you would like to credit the Photo, here are some ways you can do so
Text Link
photo Link
<span class="text-link">
<span>
<a target="_blank" href=https://pikwizard.com/photo/monochrome-dashboard-displaying-large-numeric-metric-waveform-chart-tick-markers-and-formulas/ab64f6e0d39faaf0b4de776267d6a9f9/>PikWizard</a>
</span>
</span>
<span class="image-link">
<span
style="margin: 0 0 20px 0; display: inline-block; vertical-align: middle; width: 100%;"
>
<a
target="_blank"
href="https://pikwizard.com/photo/monochrome-dashboard-displaying-large-numeric-metric-waveform-chart-tick-markers-and-formulas/ab64f6e0d39faaf0b4de776267d6a9f9/"
style="text-decoration: none; font-size: 10px; margin: 0;"
>
<img src="https://pikwizard.com/pw/medium/ab64f6e0d39faaf0b4de776267d6a9f9.jpg" style="margin: 0; width: 100%;" alt="" />
<p style="font-size: 12px; margin: 0;">PikWizard</p>
</a>
</span>
</span>
Free (free of charge)
Free for personal and commercial use.
Author: Awesome Content
Similar Free Stock Images

Premium


Premium


Premium


Premium