
- Home >
- Stock Photos >
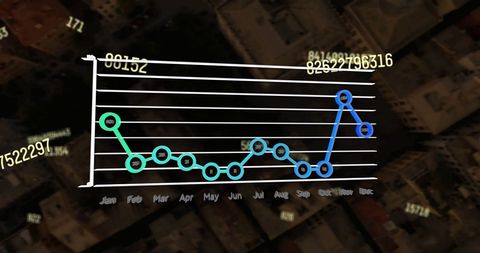
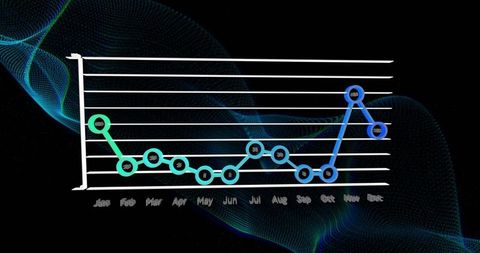
- Monthly Data Analysis with 3D Line Graph Presentation
Monthly Data Analysis with 3D Line Graph Presentation Image

3D line graph illustrates monthly data trends with highlighted points for January through December on blue background. Visual is ideal for business reports, educational materials, or analytical presentations about data trends.
Powered by  - Get 15% off with code: PIKWIZARD15


downloads
Tags:
More
Credit Photo
If you would like to credit the Photo, here are some ways you can do so
Text Link
photo Link
<span class="text-link">
<span>
<a target="_blank" href=https://pikwizard.com/photo/monthly-data-analysis-with-3d-line-graph-presentation/238c248c2daaf5239431d74f0c82382f/>PikWizard</a>
</span>
</span>
<span class="image-link">
<span
style="margin: 0 0 20px 0; display: inline-block; vertical-align: middle; width: 100%;"
>
<a
target="_blank"
href="https://pikwizard.com/photo/monthly-data-analysis-with-3d-line-graph-presentation/238c248c2daaf5239431d74f0c82382f/"
style="text-decoration: none; font-size: 10px; margin: 0;"
>
<img src="https://pikwizard.com/pw/medium/238c248c2daaf5239431d74f0c82382f.jpg" style="margin: 0; width: 100%;" alt="" />
<p style="font-size: 12px; margin: 0;">PikWizard</p>
</a>
</span>
</span>
Free (free of charge)
Free for personal and commercial use.
Author: Awesome Content
Similar Free Stock Images

Premium


Premium


Premium


Premium


Premium


Premium

Premium

Premium


Premium

Premium


Premium


Premium


Premium

Premium

Premium


Premium


Premium


Premium

Premium


Premium


Premium


Premium


Premium


Premium

Premium


Explore More Free Stock Images