
- Home >
- Stock Photos >
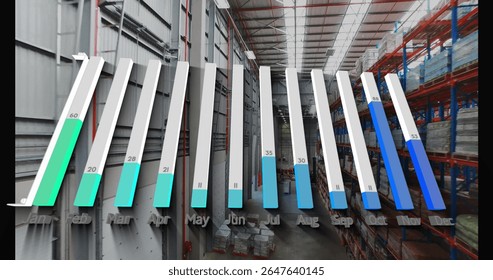
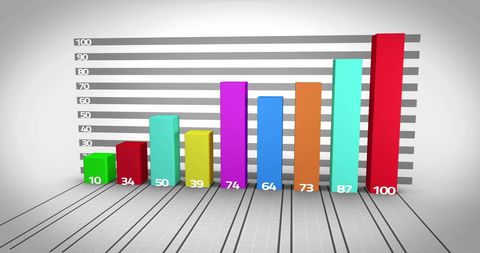
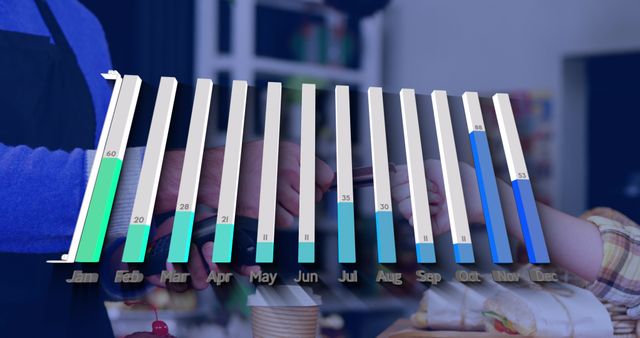
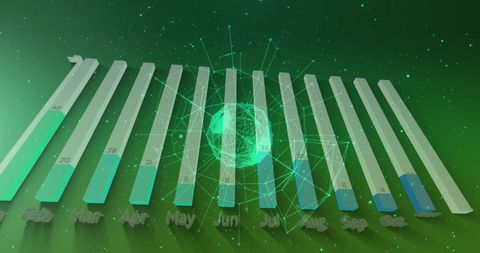
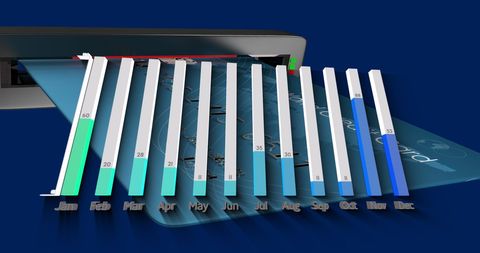
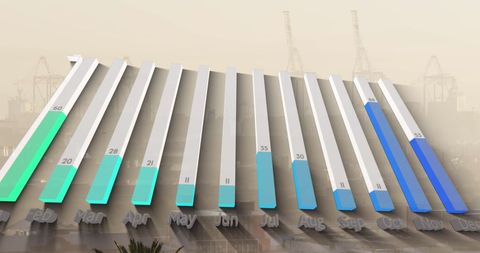
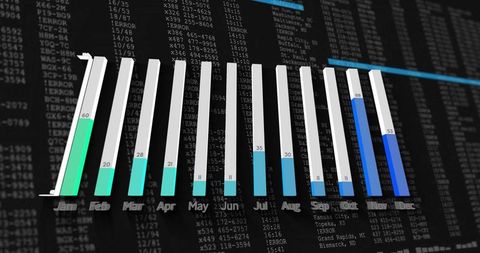
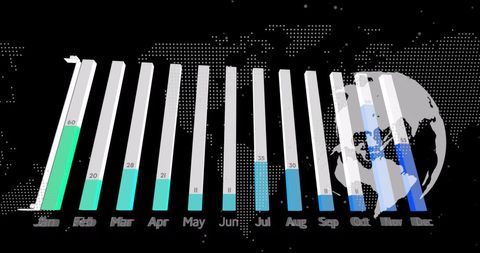
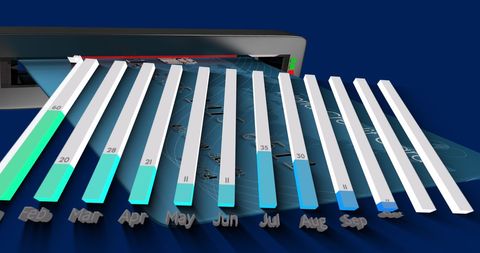
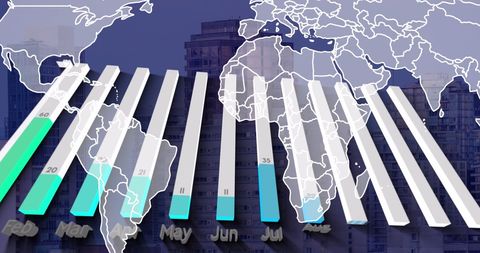
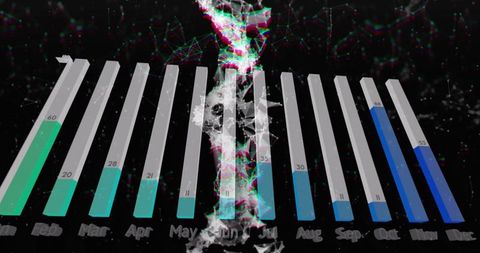
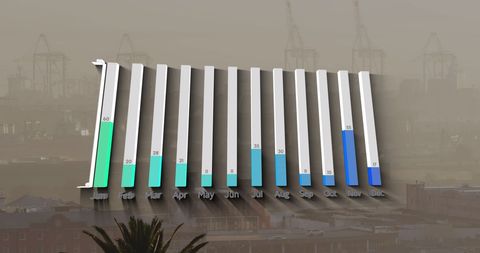
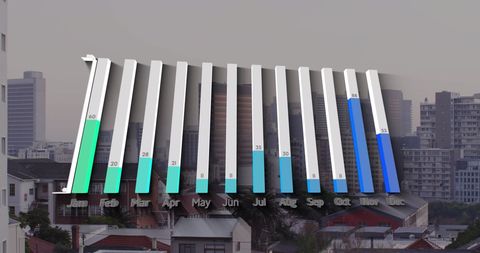
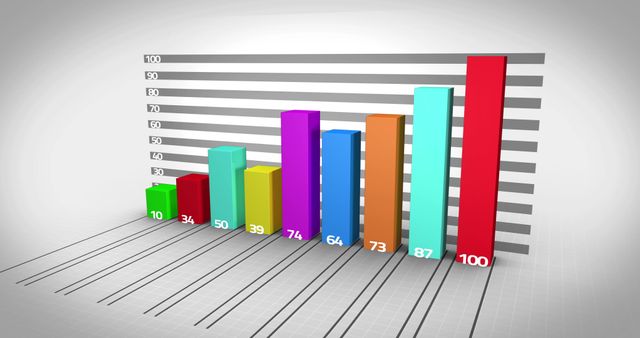
- Monthly Data Bar Chart Visualization with Infographic Design Elements
Monthly Data Bar Chart Visualization with Infographic Design Elements Image

Bar chart depicts monthly data distribution showcasing varying progress from January to December. Uses in business reports, presentations, educational materials, illustrating data trends or financial analysis.
Powered by  - Get 15% off with code: PIKWIZARD15


downloads
Tags:
More
Credit Photo
If you would like to credit the Photo, here are some ways you can do so
Text Link
photo Link
<span class="text-link">
<span>
<a target="_blank" href=https://pikwizard.com/photo/monthly-data-bar-chart-visualization-with-infographic-design-elements/a56ea9a58e59d255206a1cb0730d6890/>PikWizard</a>
</span>
</span>
<span class="image-link">
<span
style="margin: 0 0 20px 0; display: inline-block; vertical-align: middle; width: 100%;"
>
<a
target="_blank"
href="https://pikwizard.com/photo/monthly-data-bar-chart-visualization-with-infographic-design-elements/a56ea9a58e59d255206a1cb0730d6890/"
style="text-decoration: none; font-size: 10px; margin: 0;"
>
<img src="https://pikwizard.com/pw/medium/a56ea9a58e59d255206a1cb0730d6890.jpg" style="margin: 0; width: 100%;" alt="" />
<p style="font-size: 12px; margin: 0;">PikWizard</p>
</a>
</span>
</span>
Free (free of charge)
Free for personal and commercial use.
Author: Creative Art
Similar Free Stock Images

Premium


Premium


Premium


Premium

Premium


Premium


Premium

Premium

Premium


Premium


Premium

Premium


Premium

Premium


Premium

Premium


Premium


Premium


Premium

Premium

Premium


Premium


Premium

Premium

Premium


Explore More Free Stock Images