- Home >
- Stock Photos >
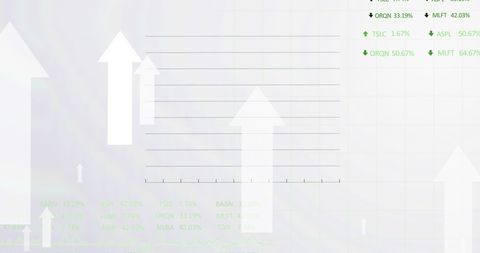
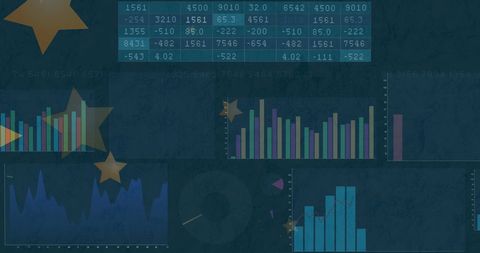
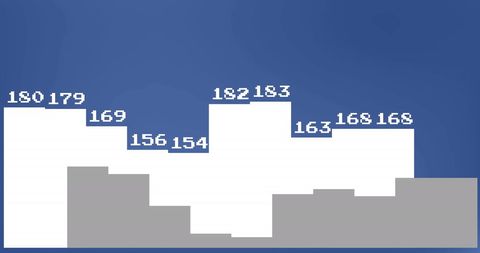
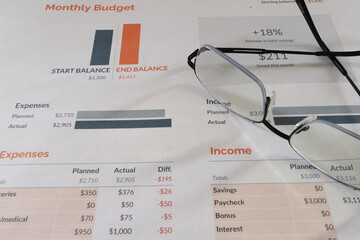
- Monthly Income vs Expenditure Business Chart Analysis
Monthly Income vs Expenditure Business Chart Analysis Image

Visual representation of monthly financial overview highlighting income, expenditure, and taxes in a segmented bar chart. Useful for business reports, presentations on financial trends or global security data visualization solutions. Suitable for illustrating financial analysis concepts for corporate or educational purposes.
Powered by 


downloads
Tags:
More
Credit Photo
If you would like to credit the Photo, here are some ways you can do so
Text Link
photo Link
<span class="text-link">
<span>
<a target="_blank" href=https://pikwizard.com/photo/monthly-income-vs-expenditure-business-chart-analysis/1f4e1a640ee9b7a74ca1eb695739e403/>PikWizard</a>
</span>
</span>
<span class="image-link">
<span
style="margin: 0 0 20px 0; display: inline-block; vertical-align: middle; width: 100%;"
>
<a
target="_blank"
href="https://pikwizard.com/photo/monthly-income-vs-expenditure-business-chart-analysis/1f4e1a640ee9b7a74ca1eb695739e403/"
style="text-decoration: none; font-size: 10px; margin: 0;"
>
<img src="https://pikwizard.com/pw/medium/1f4e1a640ee9b7a74ca1eb695739e403.jpg" style="margin: 0; width: 100%;" alt="" />
<p style="font-size: 12px; margin: 0;">PikWizard</p>
</a>
</span>
</span>
Free (free of charge)
Free for personal and commercial use.
Author: People Creations
Similar Free Stock Images
Loading...

Premium


Premium


Premium

Premium


Premium


Premium


Premium


Premium


Premium


Premium


Premium


Premium

Premium

Premium


Premium


Premium


Premium


Premium


Premium


Premium
Premium

Premium

Premium


Premium


Premium