- Home >
- Stock Photos >
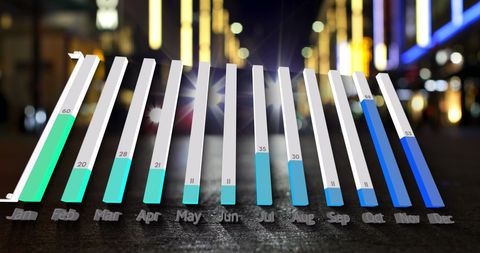
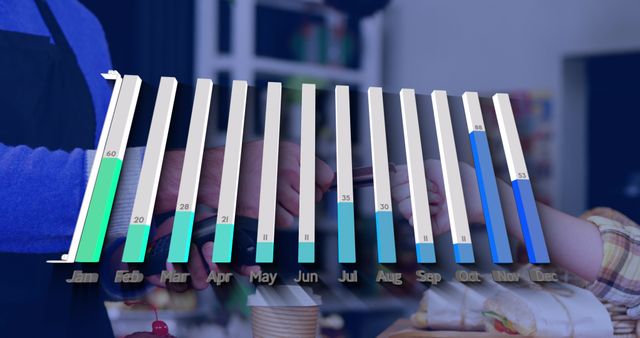
- Monthly Statistical Data Visualization with Bank Background
Monthly Statistical Data Visualization with Bank Background Image

Illustrating monthly statistical data against the backdrop of a bank, this visual offers a clear representation of data trends in a financial context. Useful for showcasing financial analytics, business presentations, strategic planning documents, and educational materials focused on data analysis and the banking industry.

downloads
Tags:
More
Credit Photo
If you would like to credit the Photo, here are some ways you can do so
Text Link
photo Link
<span class="text-link">
<span>
<a target="_blank" href=https://pikwizard.com/photo/monthly-statistical-data-visualization-with-bank-background/702ae8edf2b2dce5b97ca055909aa20c/>PikWizard</a>
</span>
</span>
<span class="image-link">
<span
style="margin: 0 0 20px 0; display: inline-block; vertical-align: middle; width: 100%;"
>
<a
target="_blank"
href="https://pikwizard.com/photo/monthly-statistical-data-visualization-with-bank-background/702ae8edf2b2dce5b97ca055909aa20c/"
style="text-decoration: none; font-size: 10px; margin: 0;"
>
<img src="https://pikwizard.com/pw/medium/702ae8edf2b2dce5b97ca055909aa20c.jpg" style="margin: 0; width: 100%;" alt="" />
<p style="font-size: 12px; margin: 0;">PikWizard</p>
</a>
</span>
</span>
Free (free of charge)
Free for personal and commercial use.
Author: People Creations