- Home >
- Stock Photos >
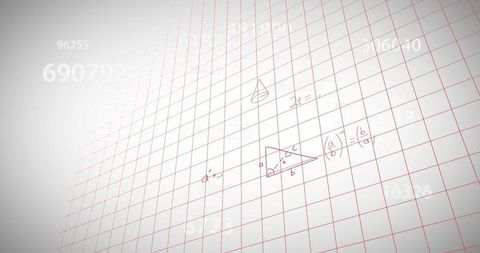
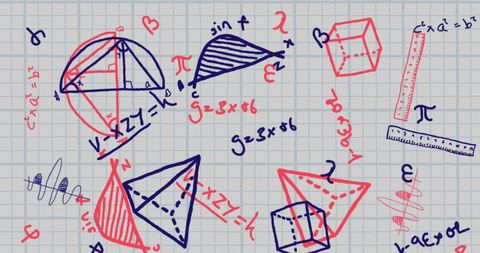
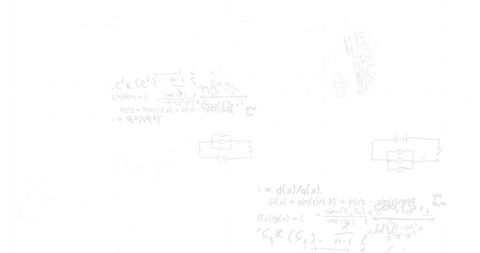
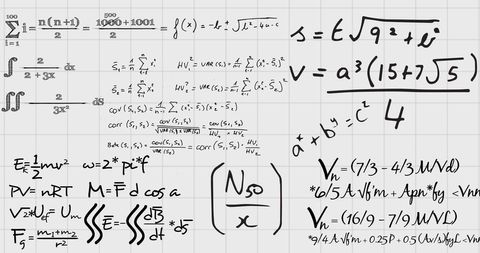
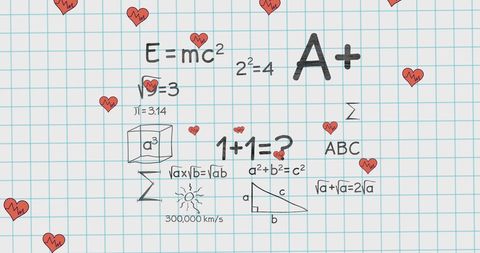
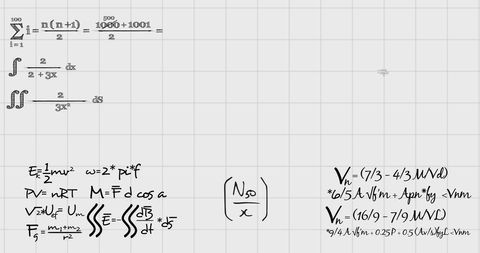
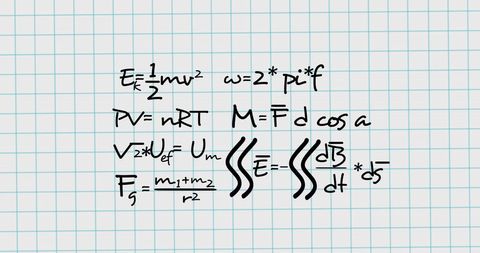
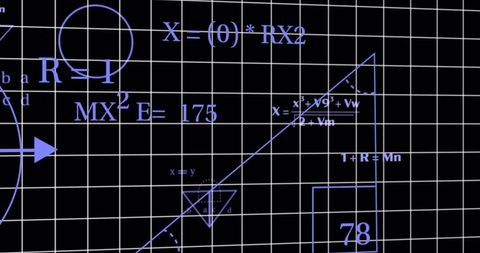
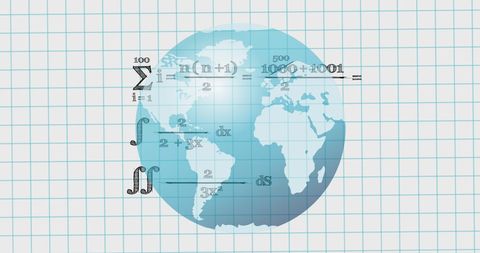
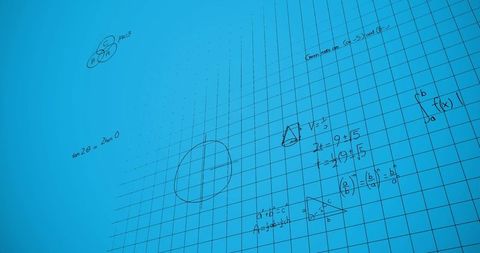
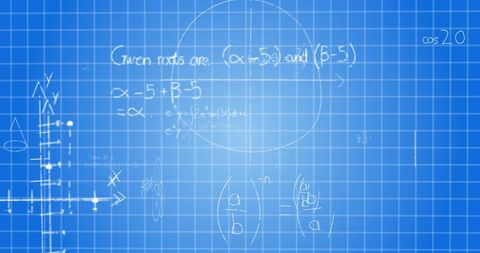
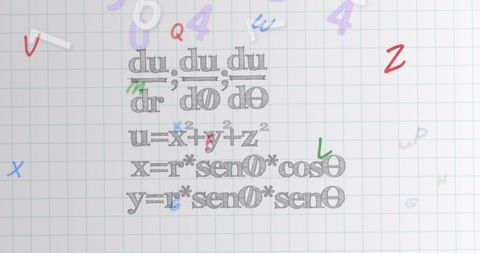
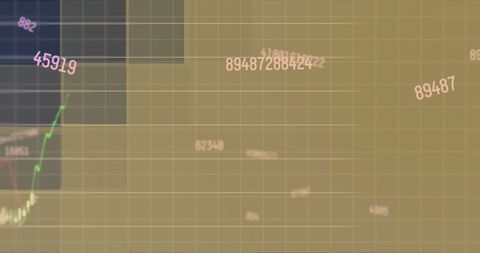
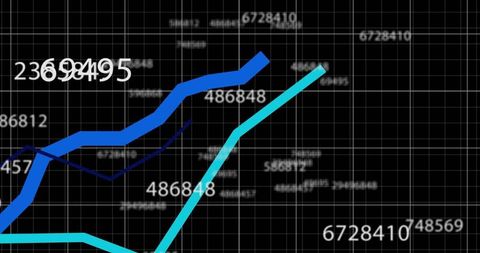
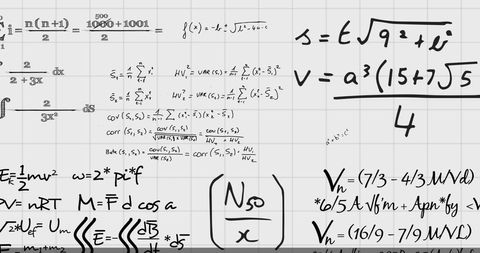
- Moving Mathematical Formulas on Graph Paper Background
Moving Mathematical Formulas on Graph Paper Background Image
Moving mathematical formulas are displayed over a graph paper background, symbolizing science and education. Useful for educational materials, online courses, and websites focusing on mathematics. Ideal for illustrating first steps in someone currently learning mathematics or for tutoring services.

downloads
Tags:
More
Credit Photo
If you would like to credit the Photo, here are some ways you can do so
Text Link
photo Link
<span class="text-link">
<span>
<a target="_blank" href=https://pikwizard.com/photo/moving-mathematical-formulas-on-graph-paper-background/abbe326c9947755bb15a35719a7fa30d/>PikWizard</a>
</span>
</span>
<span class="image-link">
<span
style="margin: 0 0 20px 0; display: inline-block; vertical-align: middle; width: 100%;"
>
<a
target="_blank"
href="https://pikwizard.com/photo/moving-mathematical-formulas-on-graph-paper-background/abbe326c9947755bb15a35719a7fa30d/"
style="text-decoration: none; font-size: 10px; margin: 0;"
>
<img src="https://pikwizard.com/pw/medium/abbe326c9947755bb15a35719a7fa30d.jpg" style="margin: 0; width: 100%;" alt="" />
<p style="font-size: 12px; margin: 0;">PikWizard</p>
</a>
</span>
</span>
Free (free of charge)
Free for personal and commercial use.
Author: Awesome Content