
- Home >
- Stock Photos >
- Multi-Line Trend Graph on Modern Digital Interface
Multi-Line Trend Graph on Modern Digital Interface Image
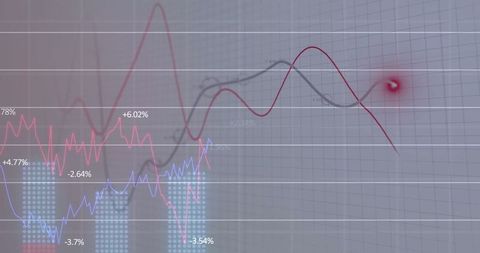
Abstract visualization for stock market trends, financial presentations, reports, or dashboards. Useful for illustrating business analytics, financial data analysis, and trend forecasts in professional settings. Ideal for conveying complex data simply and visually.
Powered by 


downloads
Tags:
More
Credit Photo
If you would like to credit the Photo, here are some ways you can do so
Text Link
photo Link
<span class="text-link">
<span>
<a target="_blank" href=https://pikwizard.com/photo/multi-line-trend-graph-on-modern-digital-interface/88fec5def9f5063a728766da678b73dd/>PikWizard</a>
</span>
</span>
<span class="image-link">
<span
style="margin: 0 0 20px 0; display: inline-block; vertical-align: middle; width: 100%;"
>
<a
target="_blank"
href="https://pikwizard.com/photo/multi-line-trend-graph-on-modern-digital-interface/88fec5def9f5063a728766da678b73dd/"
style="text-decoration: none; font-size: 10px; margin: 0;"
>
<img src="https://pikwizard.com/pw/medium/88fec5def9f5063a728766da678b73dd.jpg" style="margin: 0; width: 100%;" alt="" />
<p style="font-size: 12px; margin: 0;">PikWizard</p>
</a>
</span>
</span>
Free (free of charge)
Free for personal and commercial use.
Author: Authentic Images