- Home >
- Stock Photos >
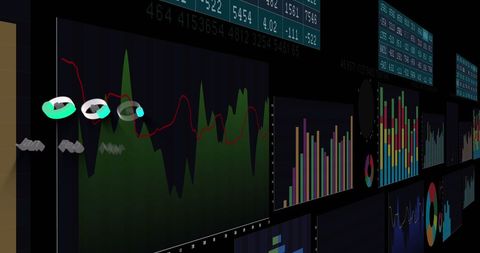
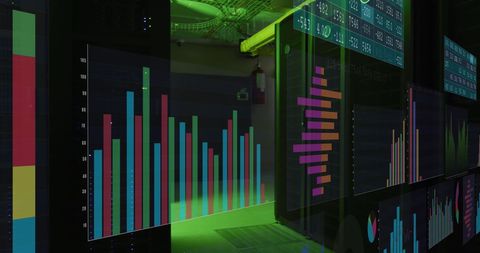
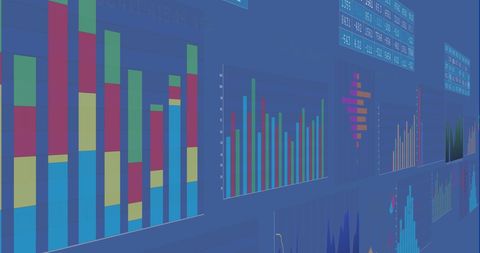
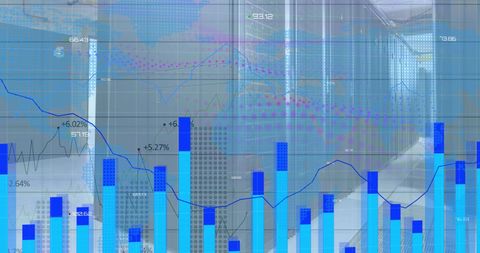
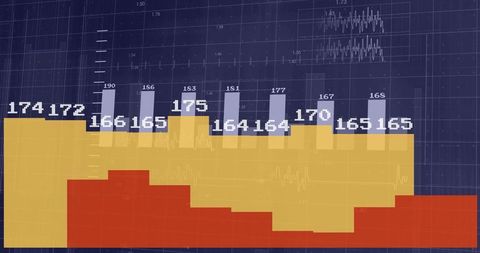
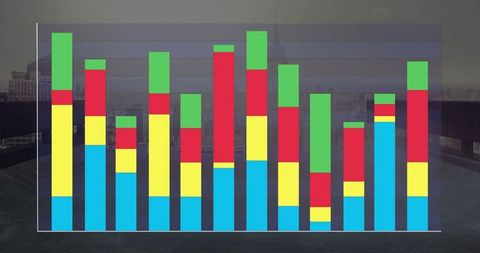
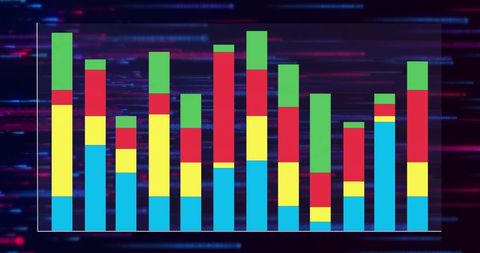
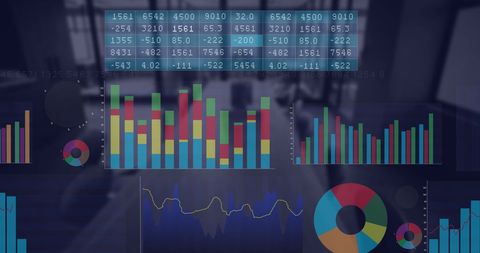
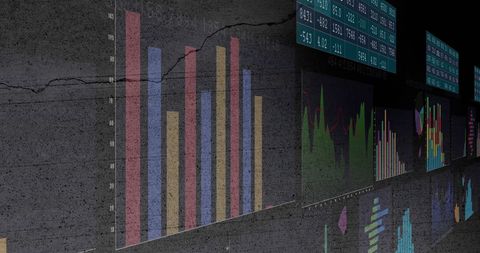
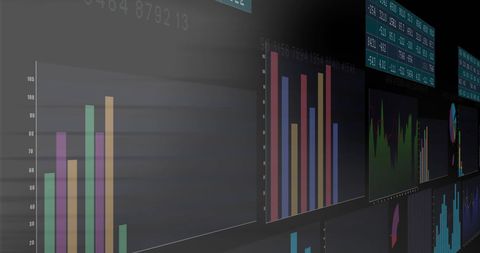
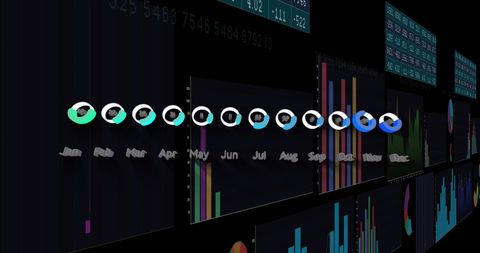
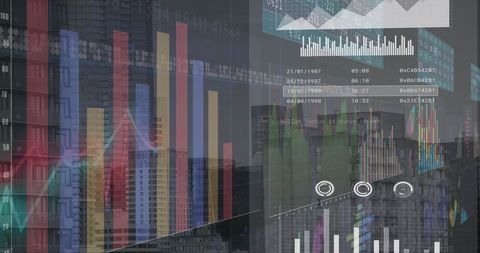
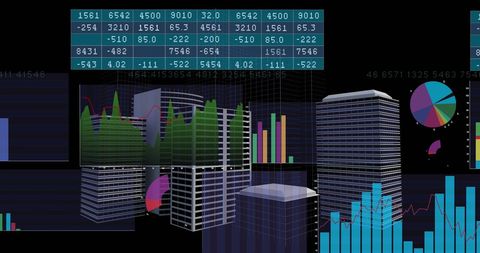
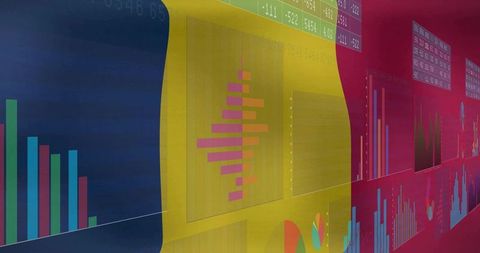
- Multi-Screen Statistical Data Processing Display
Multi-Screen Statistical Data Processing Display Image

Visual representation of statistical data on multiple digital screens showcases dynamic charts and graphs. It embodies modern business technology and data analytics, suitable for illustrating financial analysis reports, tech presentations, or stock market updates.

downloads
Tags:
More
Credit Photo
If you would like to credit the Photo, here are some ways you can do so
Text Link
photo Link
<span class="text-link">
<span>
<a target="_blank" href=https://pikwizard.com/photo/multi-screen-statistical-data-processing-display/1222126aaf13323b45e36f7cf4c0b564/>PikWizard</a>
</span>
</span>
<span class="image-link">
<span
style="margin: 0 0 20px 0; display: inline-block; vertical-align: middle; width: 100%;"
>
<a
target="_blank"
href="https://pikwizard.com/photo/multi-screen-statistical-data-processing-display/1222126aaf13323b45e36f7cf4c0b564/"
style="text-decoration: none; font-size: 10px; margin: 0;"
>
<img src="https://pikwizard.com/pw/medium/1222126aaf13323b45e36f7cf4c0b564.jpg" style="margin: 0; width: 100%;" alt="" />
<p style="font-size: 12px; margin: 0;">PikWizard</p>
</a>
</span>
</span>
Free (free of charge)
Free for personal and commercial use.
Author: Creative Art