
- Home >
- Stock Photos >
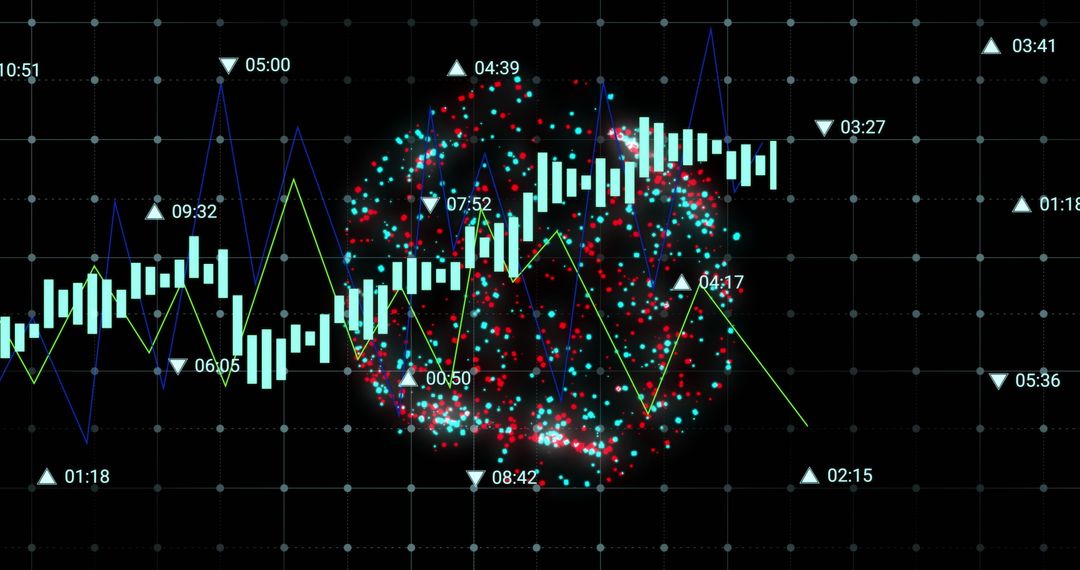
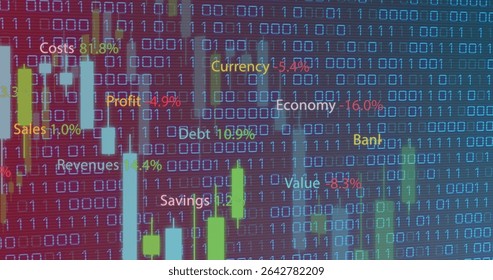
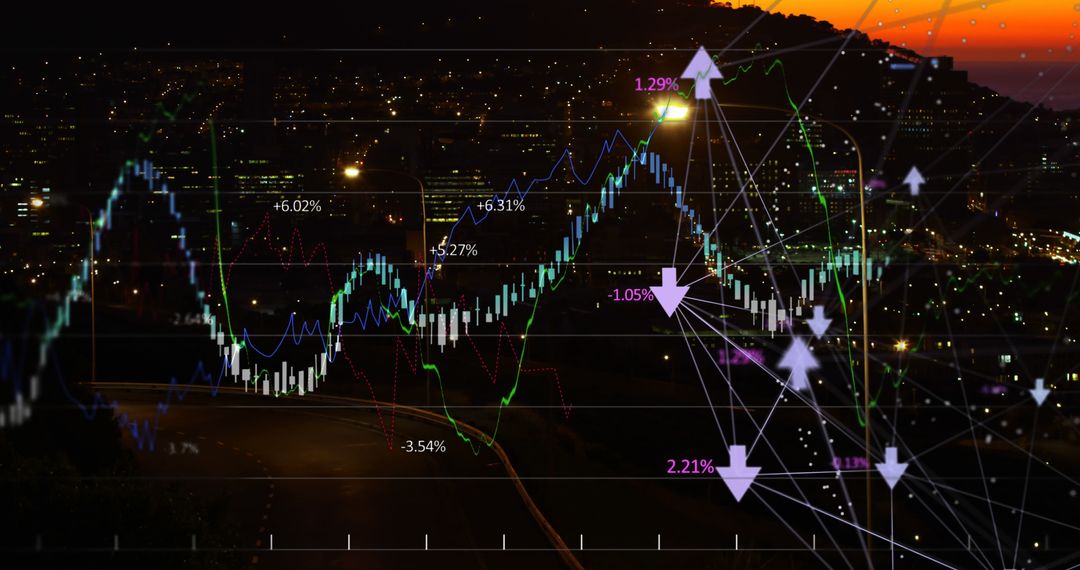
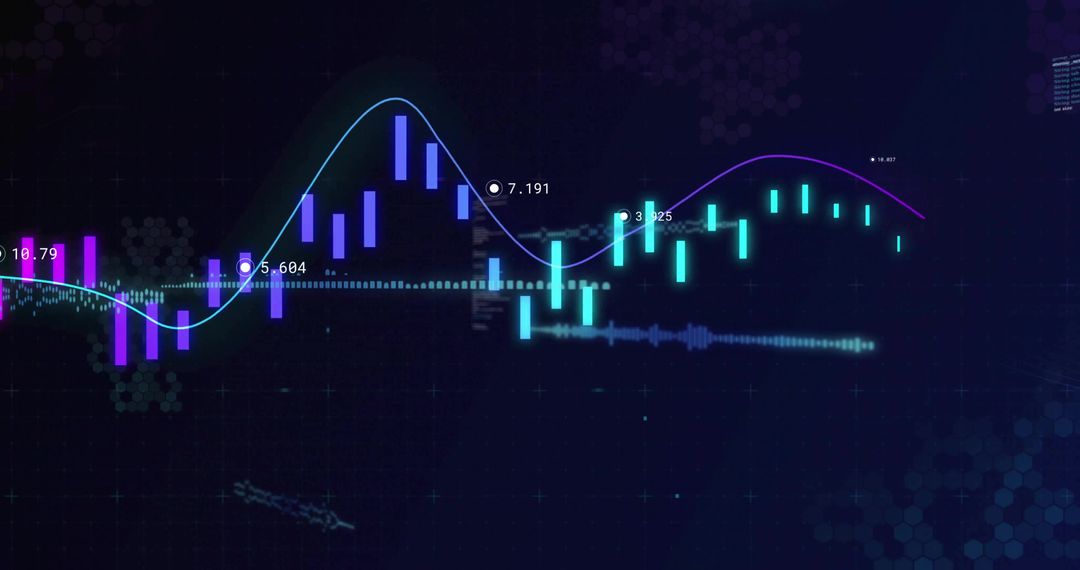
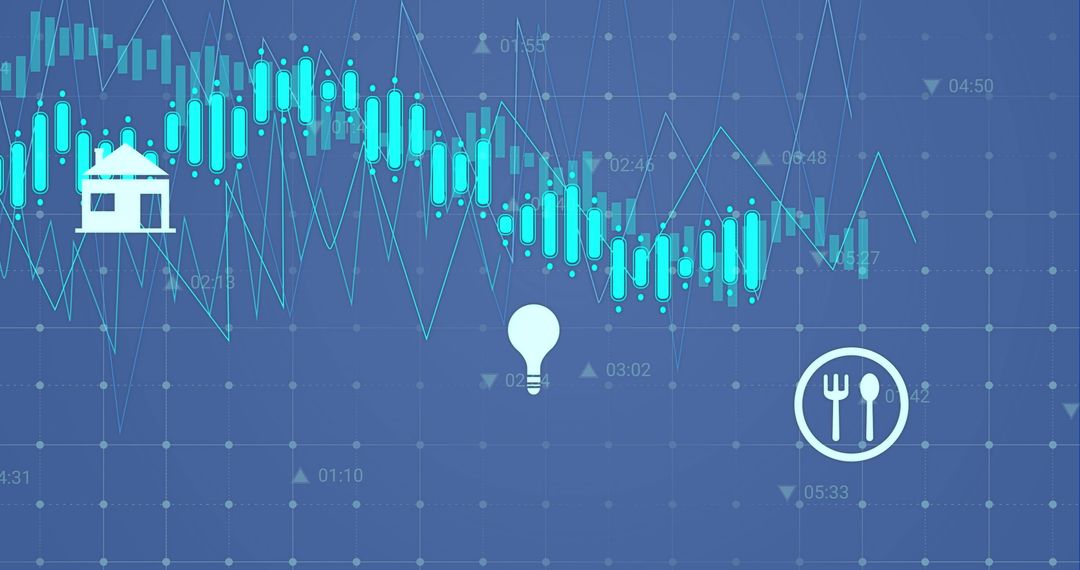
- Multicolor Financial Dashboard Showing Cyan Candlesticks and Blue-Orange Trend Network Lines
Multicolor Financial Dashboard Showing Cyan Candlesticks and Blue-Orange Trend Network Lines Image

Showing dark dotted grid background with cyan candlestick bars, layered blue and orange trend lines, and interconnected node points for network visualization. Featuring simple iconography including fork-and-knife, lightbulb, and car symbols to represent food service, ideas/innovation, and mobility metrics. Combining market-style candlesticks with smooth line graphs to communicate complex time-series and cross-sector KPIs. Supporting fintech presentations, powering investor reports, enhancing blog headers, and illustrating dashboard UI or app mockups. Suggesting use for hero banners, pitch decks, marketing materials, data-driven reports, and social media posts; recommending overlaying concise white or light text for high contrast and cropping for horizontal banner formats.
Powered by  - Get 15% off with code: PIKWIZARD15


0
downloads
downloads
Tags:
More
Credit Photo
If you would like to credit the Photo, here are some ways you can do so
Text Link
photo Link
<span class="text-link">
<span>
<a target="_blank" href=https://pikwizard.com/photo/multicolor-financial-dashboard-showing-cyan-candlesticks-and-blue-orange-trend-network-lines/8b254b4c554a2f9e66a8f83da9acd95a/>PikWizard</a>
</span>
</span>
<span class="image-link">
<span
style="margin: 0 0 20px 0; display: inline-block; vertical-align: middle; width: 100%;"
>
<a
target="_blank"
href="https://pikwizard.com/photo/multicolor-financial-dashboard-showing-cyan-candlesticks-and-blue-orange-trend-network-lines/8b254b4c554a2f9e66a8f83da9acd95a/"
style="text-decoration: none; font-size: 10px; margin: 0;"
>
<img src="https://pikwizard.com/pw/medium/8b254b4c554a2f9e66a8f83da9acd95a.jpg" style="margin: 0; width: 100%;" alt="" />
<p style="font-size: 12px; margin: 0;">PikWizard</p>
</a>
</span>
</span>
Free (free of charge)
Free for personal and commercial use.
Author: Authentic Images
Similar Free Stock Images

Premium


Premium


Premium


Premium


Premium


Premium


Premium


Premium


Premium


Premium


Premium


Premium


Premium


Premium


Premium


Premium


Premium


Premium


Premium


Premium


Premium


Premium


Premium


Premium

