
- Home >
- Free Stock Photos & Images >
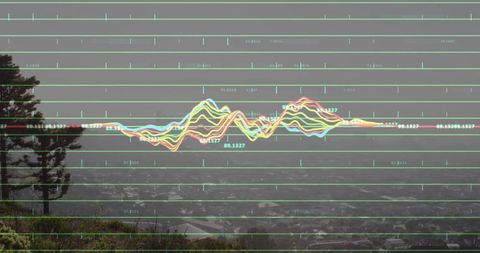
- Multicolor Line Analytics Overlay Spanning Urban Skyline with Grid Dashboard Interface
Multicolor Line Analytics Overlay Spanning Urban Skyline with Grid Dashboard Interface Free Stock Image

Depicting multicolored wavy line charts overlaying corporate skyline with horizontal green grid lines and subtle numeric markers. Transparent urban buildings receding into background, chart lines fluctuating to suggest market movement and performance trends. Neon cyan, magenta, yellow and teal lines creating high-tech dataviz aesthetic suitable for finance and technology themes. Suggested uses: Enhancing business presentations and pitch decks, serving as hero visual for fintech websites and dashboards, illustrating market analysis and investment reports, creating blog banners and social posts about data science or stock trends, providing background graphic for corporate annual reports and conference materials. Allowing space for headline and call-to-action text across top and bottom; cropping to banner or slide formats working well. Encouraging color grading to match brand palette and overlaying semi-transparent panels for legible copy.
Powered by  - Get 15% off with code: PIKWIZARD15


downloads
Tags:
More
Credit Photo
If you would like to credit the Photo, here are some ways you can do so
Text Link
photo Link
<span class="text-link">
<span>
<a target="_blank" href=https://pikwizard.com/photo/multicolor-line-analytics-overlay-spanning-urban-skyline-with-grid-dashboard-interface/471f4a4c1df89a6d1b96df633d462228/>PikWizard</a>
</span>
</span>
<span class="image-link">
<span
style="margin: 0 0 20px 0; display: inline-block; vertical-align: middle; width: 100%;"
>
<a
target="_blank"
href="https://pikwizard.com/photo/multicolor-line-analytics-overlay-spanning-urban-skyline-with-grid-dashboard-interface/471f4a4c1df89a6d1b96df633d462228/"
style="text-decoration: none; font-size: 10px; margin: 0;"
>
<img src="https://thumbs.wbm.im/pw/medium/471f4a4c1df89a6d1b96df633d462228.jpg" style="margin: 0; width: 100%;" alt="Multicolor Line Analytics Overlay Spanning Urban Skyline with Grid Dashboard Interface" />
<p style="font-size: 12px; margin: 0;">PikWizard</p>
</a>
</span>
</span>
Free (free of charge)
Free for personal and commercial use.
Author: People Creations
Similar Free Stock Images


Premium


Premium


Premium


Premium


Premium


Premium


Premium


Premium


Premium


Premium


Premium


Premium


Premium


Premium


Premium


Premium


Premium


Premium


Premium


Premium


Premium


Premium


Premium


Premium


Premium

Explore More Free Stock Images