
- Home >
- Stock Photos >
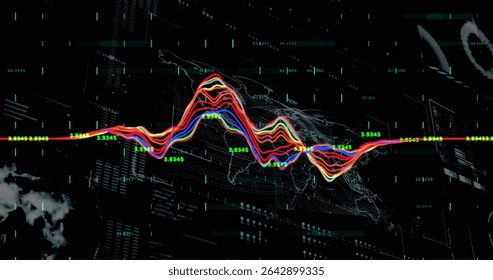
- Multicolor Waveform Analytics Dashboard Showing Real-Time Data Waves Neon Grid Overlay
Multicolor Waveform Analytics Dashboard Showing Real-Time Data Waves Neon Grid Overlay Image

Showing neon multicolor waveform lines over teal grid, offering high-contrast futuristic visual for technology and data topics. Suiting use in presentations, websites, blog posts, infographics, and marketing materials to emphasize data analysis, signal processing, and real-time monitoring. Working well as hero header, dashboard background, slide deck illustration, or article header about finance, machine learning, or IoT. Allowing overlaying of text, icons, and data widgets due to dark backdrop and bright lines for clear readability. Adapting easily for cropping, color grading, animation, and motion graphics to match brand palette and visual campaigns.
Powered by  - Get 15% off with code: PIKWIZARD15


downloads
Tags:
More
Credit Photo
If you would like to credit the Photo, here are some ways you can do so
Text Link
photo Link
<span class="text-link">
<span>
<a target="_blank" href=https://pikwizard.com/photo/multicolor-waveform-analytics-dashboard-showing-real-time-data-waves-neon-grid-overlay/2fca7527f0018ef468b0accd082cce7f/>PikWizard</a>
</span>
</span>
<span class="image-link">
<span
style="margin: 0 0 20px 0; display: inline-block; vertical-align: middle; width: 100%;"
>
<a
target="_blank"
href="https://pikwizard.com/photo/multicolor-waveform-analytics-dashboard-showing-real-time-data-waves-neon-grid-overlay/2fca7527f0018ef468b0accd082cce7f/"
style="text-decoration: none; font-size: 10px; margin: 0;"
>
<img src="https://pikwizard.com/pw/medium/2fca7527f0018ef468b0accd082cce7f.jpg" style="margin: 0; width: 100%;" alt="" />
<p style="font-size: 12px; margin: 0;">PikWizard</p>
</a>
</span>
</span>
Free (free of charge)
Free for personal and commercial use.
Author: Creative Art
Similar Free Stock Images

Premium


Premium

Premium


Premium


Premium


Premium


Premium


Premium

Premium

Premium

Premium


Premium


Premium


Premium


Premium


Premium


Premium


Premium


Premium


Premium


Premium

Premium


Premium


Premium


Premium


Explore More Free Stock Images