1. Home > 
  2. Stock Photos > 
  3. Nature-inspired Data Visualization Concept

Nature-inspired Data Visualization Concept Image

Nature-inspired Data Visualization Concept

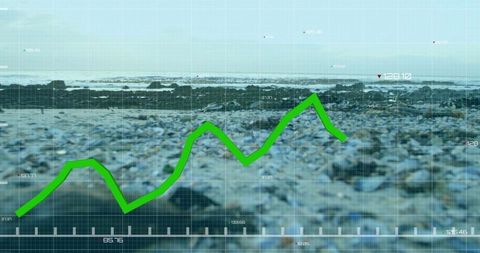
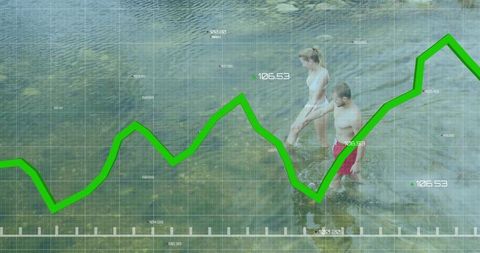
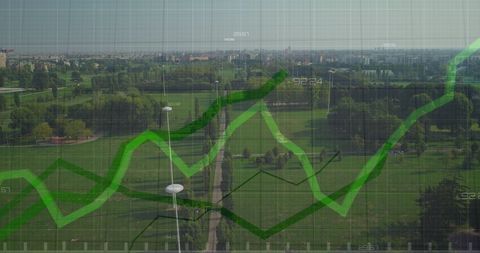
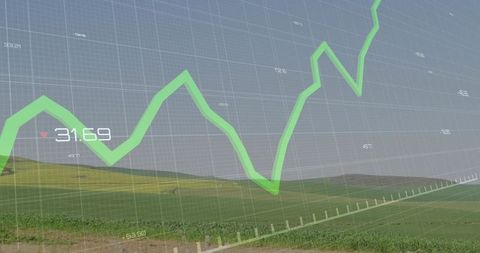
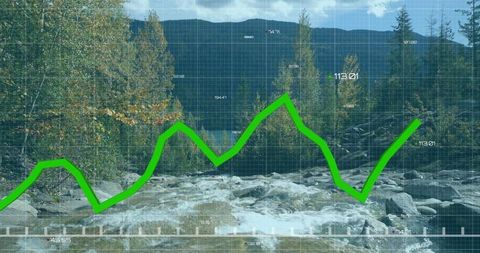
A visually captivating representation that combines elements of nature with data analytics, incorporates green line graph against translucent grid overlay on sun-dappled tree canopy, symbolizes blend of ecological awareness and modern technological design. Perfect for use in presentations about environmental sustainability, green energy analytics, and eco-friendly innovations. Suitable as a backdrop for conferences or to support ecological awareness campaigns, highlighting growth, progress or eco-data analyses.

Powered by Shutterstock logo - Get 15% off with code: PIKWIZARD15
Overlaying dashboard over mountain lake showing white candlestick bars and neon green line graph. Nature, tranquility, visualization, serenity, data, technology, landscape - Powered by Shutterstock - Get 15% off with code: PIKWIZARD15Displaying colored bar chart overlay rising from mountain stream, with red and teal line graphs. Nature, data visualization, mountain landscape, abstract analysis, eco-technology, outdoor, harmonious - Powered by Shutterstock - Get 15% off with code: PIKWIZARD15Displaying lettuce leaf showing droplets in studio with overlaying candlestick bars and line graphs. Nature, finance, visualization, macro, technology, data, organic - Powered by Shutterstock - Get 15% off with code: PIKWIZARD15Displaying transparent data visualization under tree canopy, with multicolored bars and line graphs. Nature, analytics, urban, graphic, outdoor, innovation, sustainable - Powered by Shutterstock - Get 15% off with code: PIKWIZARD15Displaying financial chart overlay at lakeshore, with candlestick bars and line graphs. Nature, landscape, profitability, investment, tranquility, data, outdoor - Powered by Shutterstock - Get 15% off with code: PIKWIZARD15

Credit Photo

If you would like to credit the Photo, here are some ways you can do so

Free (free of charge)

Free for personal and commercial use.

Author: Awesome Content

Similar Free Stock Images

Rising Green Line on Financial Digital Display
Premium
Displaying data overlaying lakeside meadow and forested hills, with 3D bar charts and line graphs. Nature, analytics, visualization, futuristic, serene, technology, scenic
Dynamic Data Trends and Growth in Business Analysis
Financial Graph Overlay on Diverse Team in Business Setting
Financial Data Graph Over Urban Cityscape
Digital Graphs and Global Data Interface Concept
Premium
Superimposing charts over winding river in forest valley with pie charts, line graphs and world map. Nature, landscape, ecology, data visualization, analytics, environment, technology
Server Room Data Analytics with Declining Graph Representation
Businessman Analyzing Financial Growth and Corresponding
Abstract Digital Graph with Data Visuals and Scope Interface
Business Team Analyzing Financial Growth Analytics
Premium
Looming wind turbine rising over grassy plain, with grid, line graph, numeric labels, copy space. Renewable energy, sustainability, technology, environment, data visualization, landscape, clean power
Rising Green Graph Lines over Business Data
Green Line Graph on Blue Digital Office Background
Dynamic Red Line Graph on Digital Black Grid Background
Financial Data Graph with Rising Green Line and Analytics Dashboard
Premium
Displaying screen overlaying stock tickers with yellow line graphs on rocky river with conifers. Futuristic, technology, nature, innovation, analytics, ecology, data visualization
Analyzing Statistical Data Over Digital Network With Cityscape
Data Center with Rising Trends on Digital Graph
Financial Data Projection in Modern Office Surroundings
Digital Data Processing Analysis Over Computer Servers
Premium
Presenting green jagged line graph showing fluctuations over sunlit grass with grid and axis labels. Analytics, data visualization, financial, technology, growth, charting, digital
Data Overlay with Rugby Athlete in Sports Arena Lighting
Global Finance Concept with Graphs and Digital Globe
Team Analyzing Trends with Overlaid Line Chart in Modern Office
Mountain Rapids with Data Line Overlay Illustrating Dynamics
Premium
Overlaying semi-transparent bar chart on plant branch in farmland with line graph and timestamp. Nature, data visualization, botanical, outdoor, environmental, digital arts, eco-friendly
Digital Agriculture and Data Visualization in a Rural Landscape
Futuristic Analytics Dashboard with Earth and Green Graph
Dynamic Financial Chart with Currency Symbols and Digital Network
Couple Wading in Water With Green Financial Chart Overlay
Global Financial Growth Trends with Data Graph Over Earth
Global Financial Market Downturn Depicted on Digital World Map
Premium
Observing elderly man in brown jacket using binoculars in forest, with grid and green line graph. Geospatial, technology, forestry, analytics, visualization, outdoor, innovation
Businessman Analyzing Financial Growth Data in Office
Dynamic Financial Graph Analyzing Market Trends
Futuristic Green Line Graph Over Global Data Charts
Dynamic Line Graph on Business Office Background Depicting Growth
Premium
Showing wheat stalks in rural field, with green light blue yellow line graphs and numeric labels. Agrarian, analytics, data visualization, pastoral, growth, sustainable, natural
Green Line Graph Showing Upward Financial Trends and Growth
Financial Analytics Chart in Digital Interface Design
Global Financial Growth Analysis with Digital Graphs and Map
Rising Data Graph with Changing Numbers on Blue Grid
Premium
Blending dry grasses with translucent stock numbers in meadow, with up or down arrows and dotted graph. Nature, finance, data visualization, minimalism, technology, outdoor, growth
Dynamic Financial Growth Chart in Modern Office
Global Success: Digital Globe and Rising Graph Lines
Dynamic Financial Data and Analytics with Euro Symbol
Financial Data Overlapping Urban Skyline
Premium
Displaying dewy grass blades in morning field, with candlestick bars, line graph and numeric labels. Nature, finance, technology, growth, investment, data visualization, freshness
Green Financial Data Chart with Technological Overlay
Financial Chart with Falling Trends in Corporate Environment
Dynamic Financial Data Graph Visualization on Black Background
Green Line Graph Overlaid on Empty Office with Data Overlay
Premium
Overlaying financial chart over mountainous forest riverbank showing rising blue and red graphs. Nature, landscape, data visualization, technology, wilderness, analytics, outdoor
Renewable Energy Integration Finance Graph and Wind Turbine
Analyst Observing Financial Trend Line on Digital Display
Interactive Green Line Graph on Analytics Dashboard with Statistics
Digital Stock Market Data Visualization with Binary Interface
Premium
Hovering chart overlay on grass with dew, showing candlestick and line graph with magenta markers. Nature, data visualization, ecosystem, analytics, outdoor, technology, financial
Dynamic 3D Green Graph Lines and Bars on Digital Interface
Rising Financial Graph Displayed Over City Skyline with Data Points
Futuristic World Map with Global Trend Lines and Digital Analytics
Global Online Data Analysis with Declining Financial Trend
Dynamic Data Trends Over Digital Graph with Pink Background
Financial Statistics Overlay Office Cadence
Premium
Blending wind turbine rotor merging into blue gridlines, with turquoise bars, green line graph. Sustainability, renewable, technology, data, innovation, environmental, digital
Financial Data Growth Over Urban Cityscape with Graph Overlay
Complex Data Analysis with Interactive Charts and Arrows
Financial Growth Data Over Urban Skyline
Dynamic Graph Analysis over Covid-19 Virus Cells
Premium
Displaying chart overlaying water, with green candlestick bars, yellow line graph, pink markers. Financial, data, visualization, digital, natural, abstract, technology
Rising Graph Line Over Digital Grid Background
Fluctuating Line Graph Over Abandoned Factory Scene
Global Business Growth Concept on Digital Globe Overlay
Rising Chart Line Over Digital Grid Representing Financial Growth
Premium
Charting green zigzag line graph over translucent grid on lake and forest view, showing data labels. Scenic, nature, landscape, data visualization, analytics, tranquility, harmony
Biometric Analysis with Financial Data Overlay
Financial Growth Graph Overlay on Server Room Infrastructure
Eco-Friendly Finance Concept with Digital Analytics
Dynamic Stock Market Data and Cityscape Background
Premium
Displaying red zigzag line graph with arrow fluctuating on tall dry grass with green grid overlay. Data visualization, analytics, financial, presentation, minimalistic, abstract, growth
Dynamic Stock Market Graph Fluctuating in Modern Office
Ascending Green Line Graph Overlay on Urban Skyline for Business Growth Concept
Smiling Businesswoman with Data Charts Overlay in Modern Office
Financial Graph with Skyscrapers Illustrating Market Trends
Premium
Floating translucent financial chart over rural hills and line graphs, with colorful candlesticks. Landscape, data visualization, analytics, natural, tranquil, abstract, modern
Neon Green Polyline Chart Tracing Rocky Coastline
Businesswoman with Suitcase Walking Viewed Through Financial Analytics
Innovative Financial Trading Interface with Graphs
Global Financial Analytics: Green Line Graph on Digital Globe
Premium
Displaying horse nose wearing green halter at farm, with grid overlay and line graphs, copy space. Equine, veterinary, rural, outdoor, technology, analytics, data visualization
Team Collaborating in Office with Data Analysis Overlay
Beveled Green Trend Line Moving Across Dark Blue Grid Showing Market Data Visualization
Digital Business and Technology Abstract with Declining Growth
Green Financial Data Line Graph Over Cityscape Background
Diverse Businesswomen Analyzing Financial Growth with Digital Graph Overlay
Business Professional with Financial Growth Graph in Modern Office
Premium
Displaying digital line graph overlay across rural countryside, with red line and blue bars. Landscape, data visualization, financial graph, natural scenery, analytics, rural environment, technology
Green Line Graph Overlaying Modern Office Setting
Red Financial Trendline in Digital Interface Background
Diverse Professionals Analyzing Financial Growth with Technology
Financial Data Visualization with Green Graph Line on Blue Background
Premium
Overlaying blue green candlestick bars highlighting coastal bay, with jagged line graph indicators. Seascape, data visualization, economic analysis, tranquility, weather, nature, finance
Dynamic Financial Growth Graph on Blue Grid Background
Dynamic Growth Chart Overlaying Urban Skyline
Innovation in Green Technology Amidst Urban Expansion
Dynamic Statistical Graphs on Gradient Background
Premium
Displaying clear bar chart and line graph overlay on autumn river rapids, with currency symbols. Nature, data visualization, financial analytics, outdoor, landscape, technology, digital
Colorful Graph Analysis in Digital Interface Over Blue Background
Dynamic Growth Graph Over Night City Traffic Scene
Growing Success Trend with Data Chart over Pink Gradient
Global Financial Data Trading Analytics Over Flames Concept
Premium
Translucent bars hovering above pasture, ocean waters on rocky coast, showing sine wave line graphs. Aerial view, coastal landscape, data visualization, nature, analytics, technology, environmental
Global Financial Data and Digital Connectivity Concept
Dynamic Green Business Data Graph with Office Backdrop
Businesswoman Analyzing Financial Growth Data in Office
Bright Green Line Chart Overlapping Scenic Rocky Beach
Premium
Standing two dark-coated dogs on pebble beach, overlaid with grid, line graphs and candlestick bars. Wildlife, nature, analytics, data visualization, outdoor, minimalistic, tranquil
Dynamic Financial Analysis with Green Trend Line on Grid
Renewable Energy Statistics Overlaid on Grass Field
Graph Analysis with Scientific and Mathematical Formulas Overlay
Elegant Mature Woman Smiling in Garden with Data Overlay
Premium
Displaying financial chart overlaying orchard view, with candlestick bars and colored line graphs. Agriculture, finance, data visualization, analytics, modern, vibrant, industry
Global Market Trends Featuring Multi-Series Line Charts Over Dotted World Map and Grid