
- Home >
- Stock Photos >
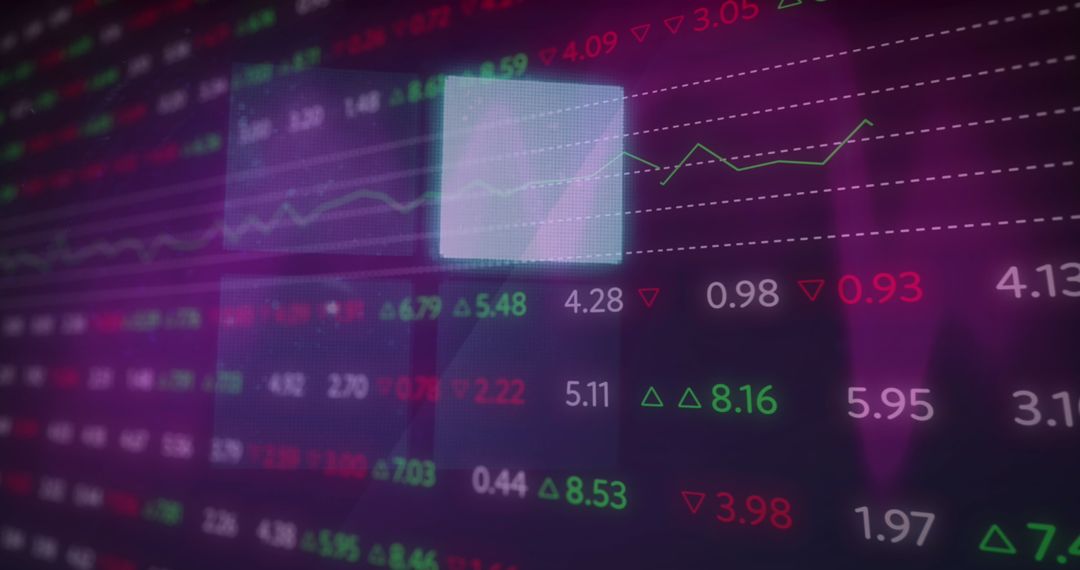
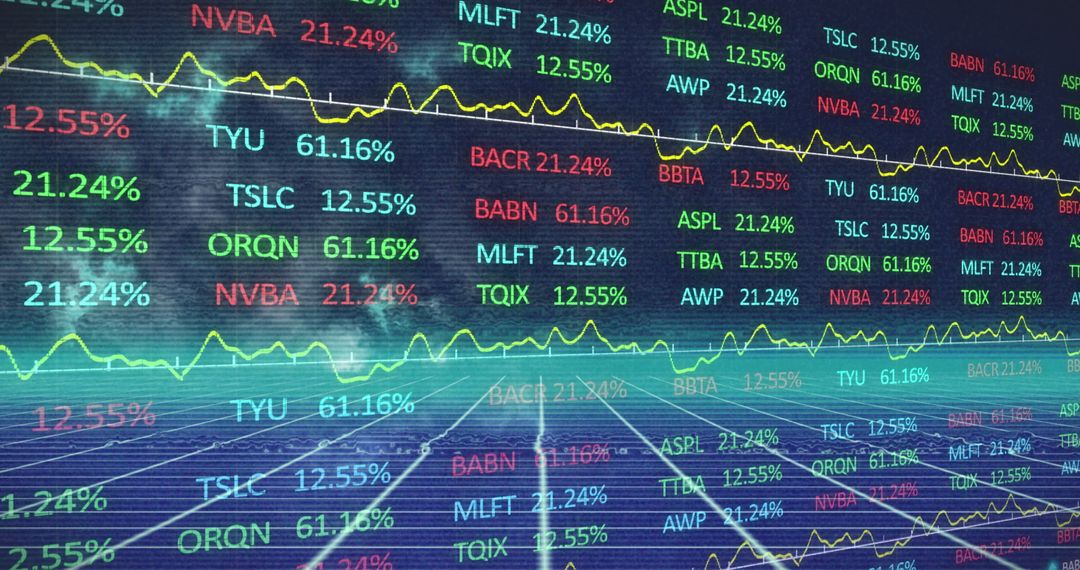
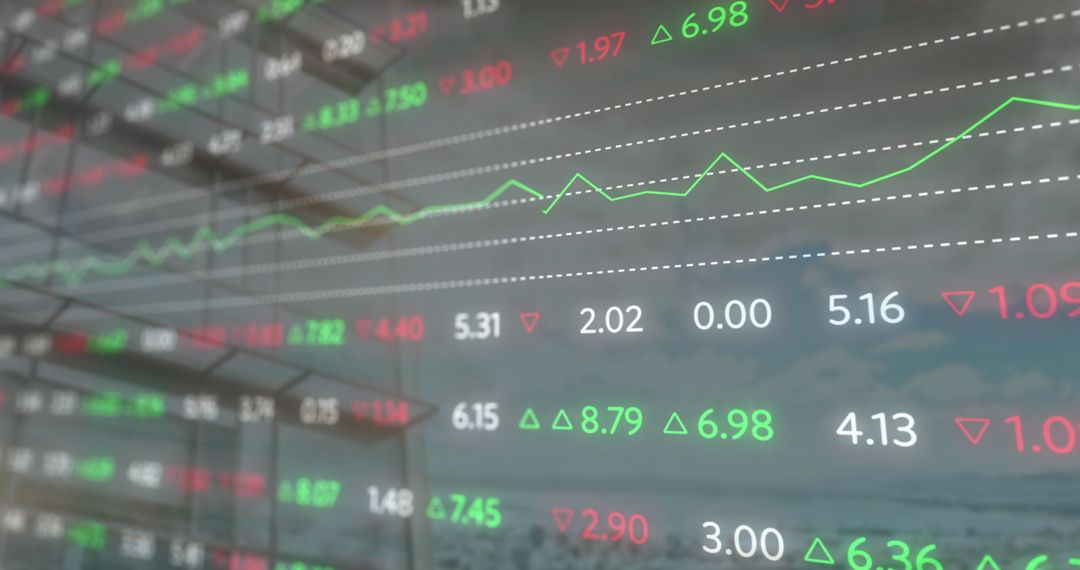
- Navigating Stock Market Trends through Digital Analytics
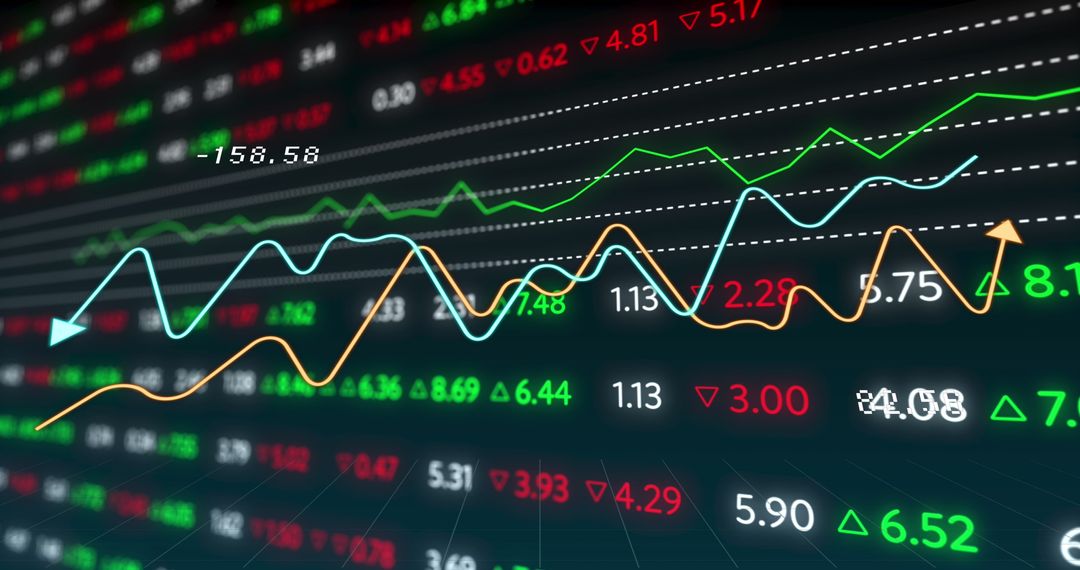
Navigating Stock Market Trends through Digital Analytics Image

Green and red numerical data are seen on a digital screen, indicating stock market fluctuations. This image signifies active stock trading with dynamic price changes. The overlay of graphs emphasizes modeling of financial trends. Suitable for financial analysis content, stock market updates or investment apps, and business strategy presentations.
Powered by 


2
downloads
downloads
Tags:
More
Credit Photo
If you would like to credit the Photo, here are some ways you can do so
Text Link
photo Link
<span class="text-link">
<span>
<a target="_blank" href=https://pikwizard.com/photo/navigating-stock-market-trends-through-digital-analytics/9c4deefc14530a518c84e33470b4f638/>PikWizard</a>
</span>
</span>
<span class="image-link">
<span
style="margin: 0 0 20px 0; display: inline-block; vertical-align: middle; width: 100%;"
>
<a
target="_blank"
href="https://pikwizard.com/photo/navigating-stock-market-trends-through-digital-analytics/9c4deefc14530a518c84e33470b4f638/"
style="text-decoration: none; font-size: 10px; margin: 0;"
>
<img src="https://pikwizard.com/pw/medium/9c4deefc14530a518c84e33470b4f638.jpg" style="margin: 0; width: 100%;" alt="" />
<p style="font-size: 12px; margin: 0;">PikWizard</p>
</a>
</span>
</span>
Free (free of charge)
Free for personal and commercial use.
Author: Awesome Content
Similar Free Stock Images

Premium


Premium


Premium


Premium


Premium


Premium


Premium


Premium


Premium


Premium


Premium


Premium


Premium


Premium


Premium


Premium


Premium


Premium


Premium


Premium


Premium


Premium


Premium


Premium

