- Home >
- Stock Photos >
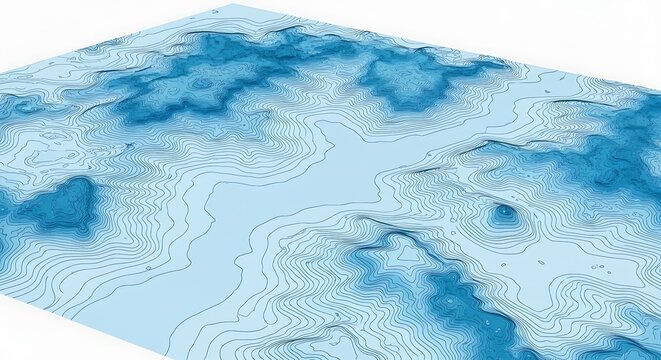
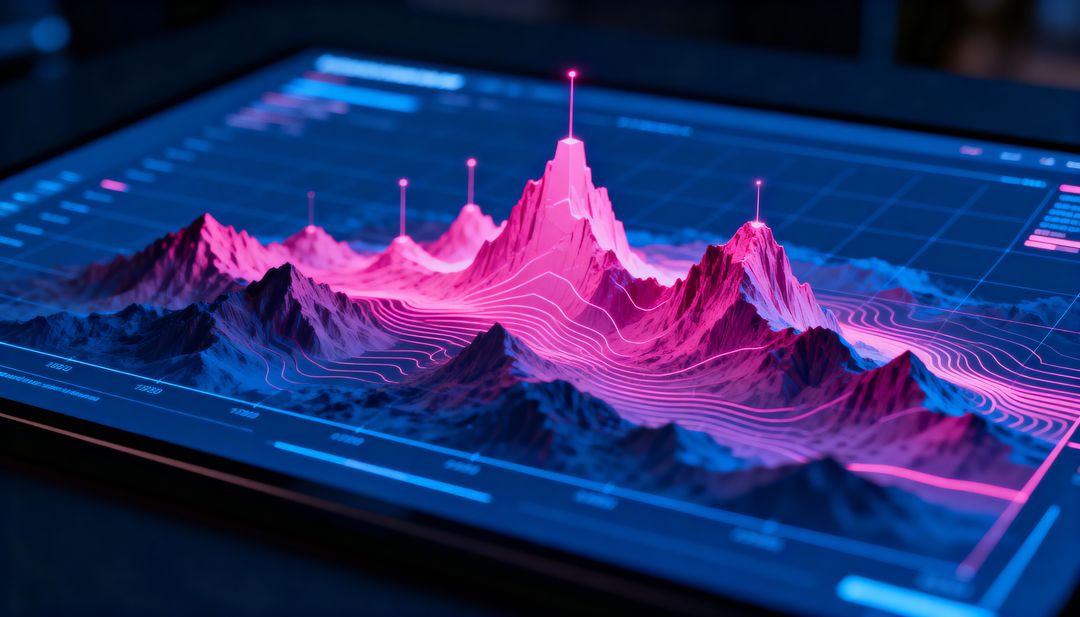
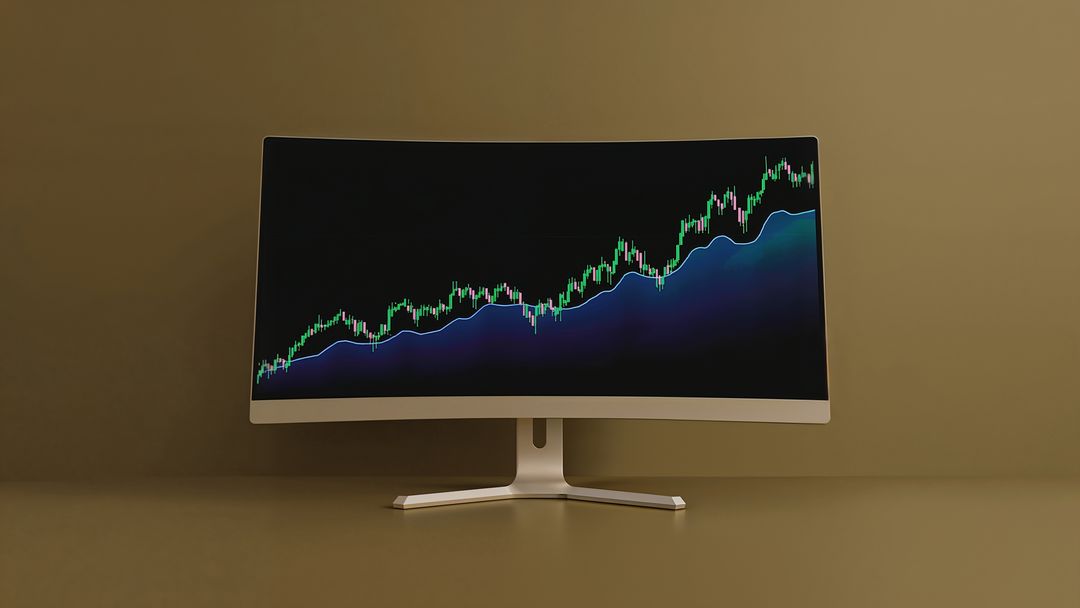
- Neon 3D Contour Data Visualization Showing Pink Blue Topographic Analytics Dashboard
Neon 3D Contour Data Visualization Showing Pink Blue Topographic Analytics Dashboard Image

AI Generated Image. Showing neon pink and blue 3D contour lines across widescreen monitor. Suited for tech marketing, data science blog headers, fintech presentations, AI research reports, and dashboard UI concepts. Working as hero background for websites, slide decks, social posts, and advertising. Highlighting big data, analytics, machine learning, and financial forecasting concepts. Offering high contrast neon palette for modern branding and editorial uses. Providing space for overlay text, logos, and chart annotations.
Powered by 


0
downloads
downloads
Tags:
More
Credit Photo
If you would like to credit the Photo, here are some ways you can do so
Text Link
photo Link
<span class="text-link">
<span>
<a target="_blank" href=https://pikwizard.com/photo/neon-3d-contour-data-visualization-showing-pink-blue-topographic-analytics-dashboard/06356166b88dc06177be8a05c1e06a61/>PikWizard</a>
</span>
</span>
<span class="image-link">
<span
style="margin: 0 0 20px 0; display: inline-block; vertical-align: middle; width: 100%;"
>
<a
target="_blank"
href="https://pikwizard.com/photo/neon-3d-contour-data-visualization-showing-pink-blue-topographic-analytics-dashboard/06356166b88dc06177be8a05c1e06a61/"
style="text-decoration: none; font-size: 10px; margin: 0;"
>
<img src="https://pikwizard.com/pw/medium/06356166b88dc06177be8a05c1e06a61.jpg" style="margin: 0; width: 100%;" alt="" />
<p style="font-size: 12px; margin: 0;">PikWizard</p>
</a>
</span>
</span>
Free (free of charge)
Free for personal and commercial use.
Author: AI Creator
Similar Free Stock Images

Premium


Premium


Premium


Premium


Premium


Premium


Premium


Premium


Premium


Premium


Premium


Premium


Premium


Premium


Premium


Premium


Premium


Premium


Premium


Premium


Premium


Premium


Premium


Premium