- Home >
- Stock Photos >
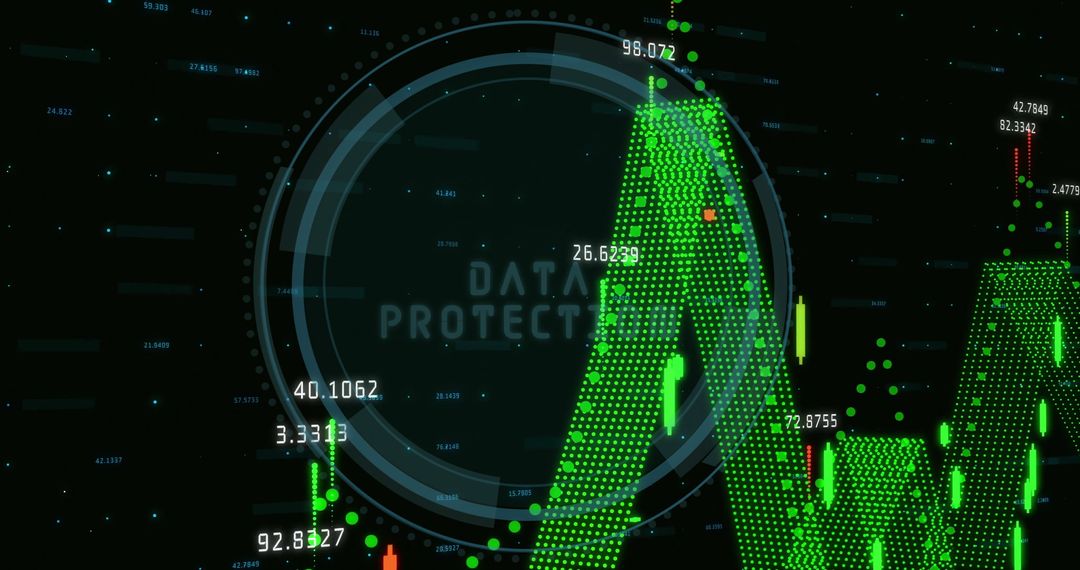
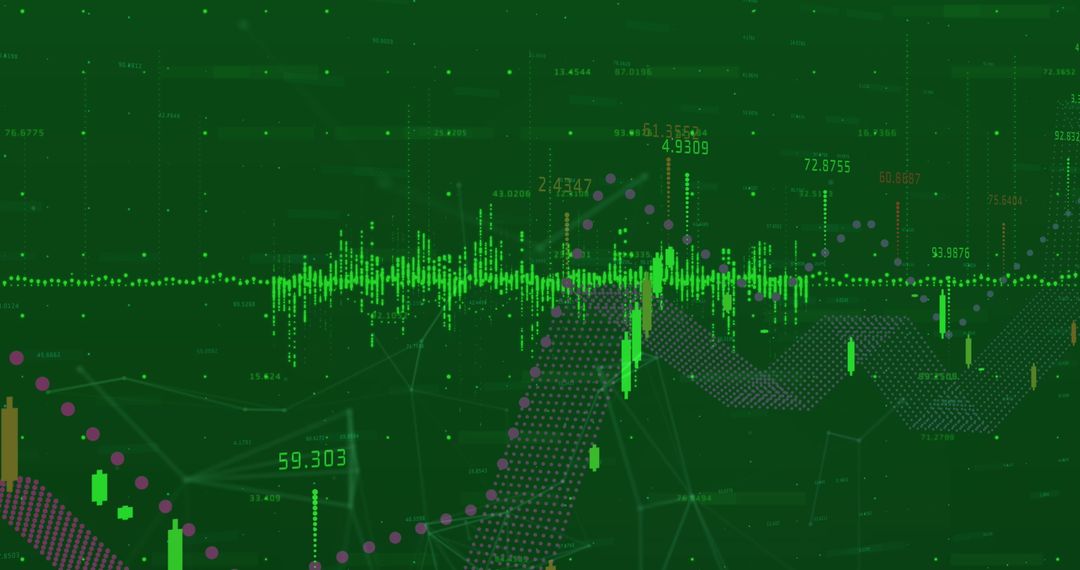
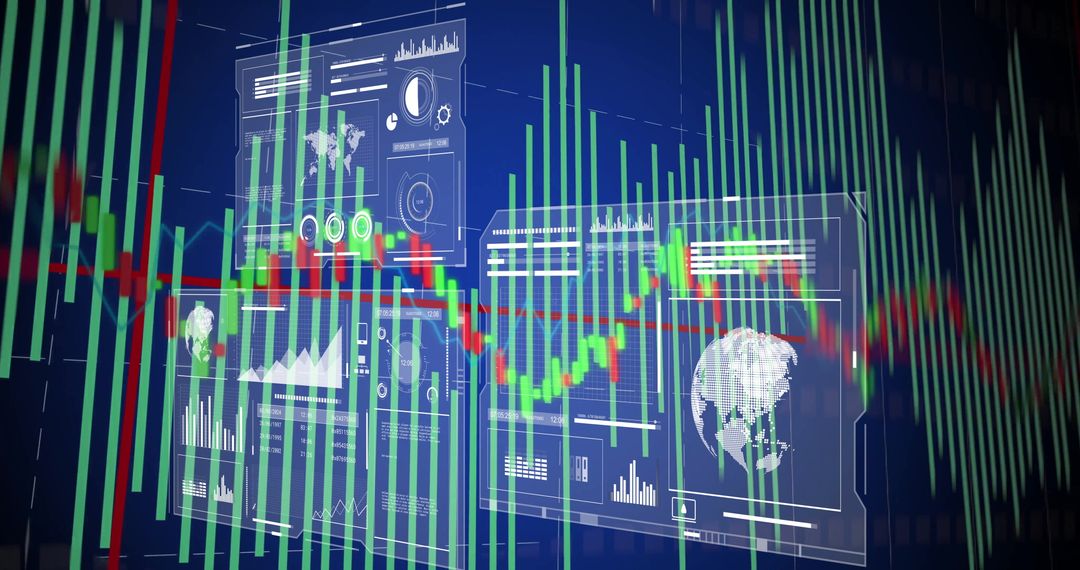
- Neon 3D Financial Dashboard Visualizing Rising Market Trend with Candlesticks and Gauge
Neon 3D Financial Dashboard Visualizing Rising Market Trend with Candlesticks and Gauge Image

Showing neon 3D graph rising across dark grid of dashboard widgets, featuring yellow trend line, green and red candlesticks, circular gauge and multiple data panels. Emphasizing movement, depth, high-tech aesthetics and real-time analytics. Working as hero banner for fintech product, serving as background for webinar slides, providing visual support for articles about market volatility, algorithmic trading and data-driven investment strategies. Featuring color palette with bright neon accents on dark background, allowing overlay text and UI elements. Offering high visual contrast and dynamic composition, fitting presentations, social media posts, blog headers, pitch decks and marketing campaigns.
Powered by 


0
downloads
downloads
Tags:
More
Credit Photo
If you would like to credit the Photo, here are some ways you can do so
Text Link
photo Link
<span class="text-link">
<span>
<a target="_blank" href=https://pikwizard.com/photo/neon-3d-financial-dashboard-visualizing-rising-market-trend-with-candlesticks-and-gauge/7e20effb59b6a0e6f859b6aeadff41f1/>PikWizard</a>
</span>
</span>
<span class="image-link">
<span
style="margin: 0 0 20px 0; display: inline-block; vertical-align: middle; width: 100%;"
>
<a
target="_blank"
href="https://pikwizard.com/photo/neon-3d-financial-dashboard-visualizing-rising-market-trend-with-candlesticks-and-gauge/7e20effb59b6a0e6f859b6aeadff41f1/"
style="text-decoration: none; font-size: 10px; margin: 0;"
>
<img src="https://pikwizard.com/pw/medium/7e20effb59b6a0e6f859b6aeadff41f1.jpg" style="margin: 0; width: 100%;" alt="" />
<p style="font-size: 12px; margin: 0;">PikWizard</p>
</a>
</span>
</span>
Free (free of charge)
Free for personal and commercial use.
Author: Awesome Content
Similar Free Stock Images

Premium


Premium


Premium


Premium


Premium


Premium


Premium


Premium


Premium


Premium


Premium


Premium


Premium


Premium


Premium


Premium


Premium


Premium


Premium


Premium


Premium


Premium


Premium


Premium