
- Home >
- Stock Photos >
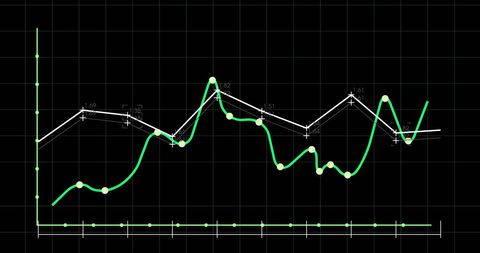
- Neon AI Data Visualization Dashboard Displaying Neural-Tree Line Chart with Nodes
Neon AI Data Visualization Dashboard Displaying Neural-Tree Line Chart with Nodes Image

Depicting neon green line chart with circular nodes over dark grid and central neural-tree circuit, conveying AI analytics and algorithm performance. Showing real-time trend tracking, predictive modeling visualization, and system monitoring. Serving tech blog headers, pitch decks, website hero banners, product landing pages, investor reports, UI/UX mockups. Supporting overlay text and headline placement through negative space and high contrast. Encouraging color customization and cropping for brand alignment. Working well for presentations about machine learning, fintech analytics, big data dashboards, and product demos.
Powered by 


downloads
Tags:
More
Credit Photo
If you would like to credit the Photo, here are some ways you can do so
Text Link
photo Link
<span class="text-link">
<span>
<a target="_blank" href=https://pikwizard.com/photo/neon-ai-data-visualization-dashboard-displaying-neural-tree-line-chart-with-nodes/20f45ef0b88f9d3134fdd5e46fecc676/>PikWizard</a>
</span>
</span>
<span class="image-link">
<span
style="margin: 0 0 20px 0; display: inline-block; vertical-align: middle; width: 100%;"
>
<a
target="_blank"
href="https://pikwizard.com/photo/neon-ai-data-visualization-dashboard-displaying-neural-tree-line-chart-with-nodes/20f45ef0b88f9d3134fdd5e46fecc676/"
style="text-decoration: none; font-size: 10px; margin: 0;"
>
<img src="https://pikwizard.com/pw/medium/20f45ef0b88f9d3134fdd5e46fecc676.jpg" style="margin: 0; width: 100%;" alt="" />
<p style="font-size: 12px; margin: 0;">PikWizard</p>
</a>
</span>
</span>
Free (free of charge)
Free for personal and commercial use.
Author: People Creations
Similar Free Stock Images

Premium


Premium

Premium

Premium


Premium


Premium


Premium


Premium


Premium


Premium

Premium


Premium


Premium

Premium

Premium


Premium


Premium


Premium

Premium


AI


Premium


Premium

Premium


AI


Premium


Premium

Premium


Explore More Free Stock Images