- Home >
- Stock Photos >
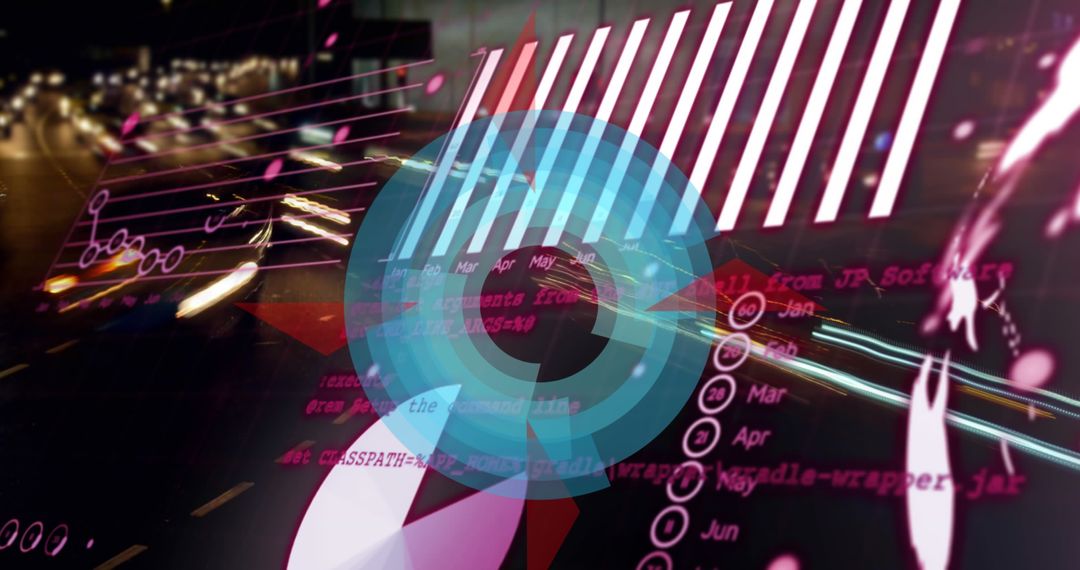
- Neon Analytics Dashboard with Magenta Bar Chart and Faceted Pie in Isometric Grid
Neon Analytics Dashboard with Magenta Bar Chart and Faceted Pie in Isometric Grid Image

Vivid neon composition showcasing magenta bar chart, faceted pie and teal isometric grid for modern analytics concept. High-contrast color palette creating futuristic, tech-forward mood for marketing and presentation use. Ideal for illustrating dashboard UI mockups, fintech reports, business intelligence slides, website hero banners and blog headers. Working well for social media graphics, pitch deck backgrounds, app design prototypes and advertising campaigns focused on data-driven services. Layering space and depth allowing overlaying of logos, headlines and data callouts. Ready for cropping to horizontal or square formats and for use as visual asset in templates, tutorials and editorial about analytics or technology.
Powered by 


0
downloads
downloads
Tags:
More
Credit Photo
If you would like to credit the Photo, here are some ways you can do so
Text Link
photo Link
<span class="text-link">
<span>
<a target="_blank" href=https://pikwizard.com/photo/neon-analytics-dashboard-with-magenta-bar-chart-and-faceted-pie-in-isometric-grid/930cfce93d8a2b723b39e05cd36bfe09/>PikWizard</a>
</span>
</span>
<span class="image-link">
<span
style="margin: 0 0 20px 0; display: inline-block; vertical-align: middle; width: 100%;"
>
<a
target="_blank"
href="https://pikwizard.com/photo/neon-analytics-dashboard-with-magenta-bar-chart-and-faceted-pie-in-isometric-grid/930cfce93d8a2b723b39e05cd36bfe09/"
style="text-decoration: none; font-size: 10px; margin: 0;"
>
<img src="https://pikwizard.com/pw/medium/930cfce93d8a2b723b39e05cd36bfe09.jpg" style="margin: 0; width: 100%;" alt="" />
<p style="font-size: 12px; margin: 0;">PikWizard</p>
</a>
</span>
</span>
Free (free of charge)
Free for personal and commercial use.
Author: Awesome Content
Similar Free Stock Images

Premium


Premium


Premium


Premium


Premium


Premium


Premium


Premium


Premium


Premium


Premium


Premium


Premium


Premium


Premium


Premium


Premium


Premium


Premium


Premium


Premium


Premium


Premium


Premium