- Home >
- Stock Photos >
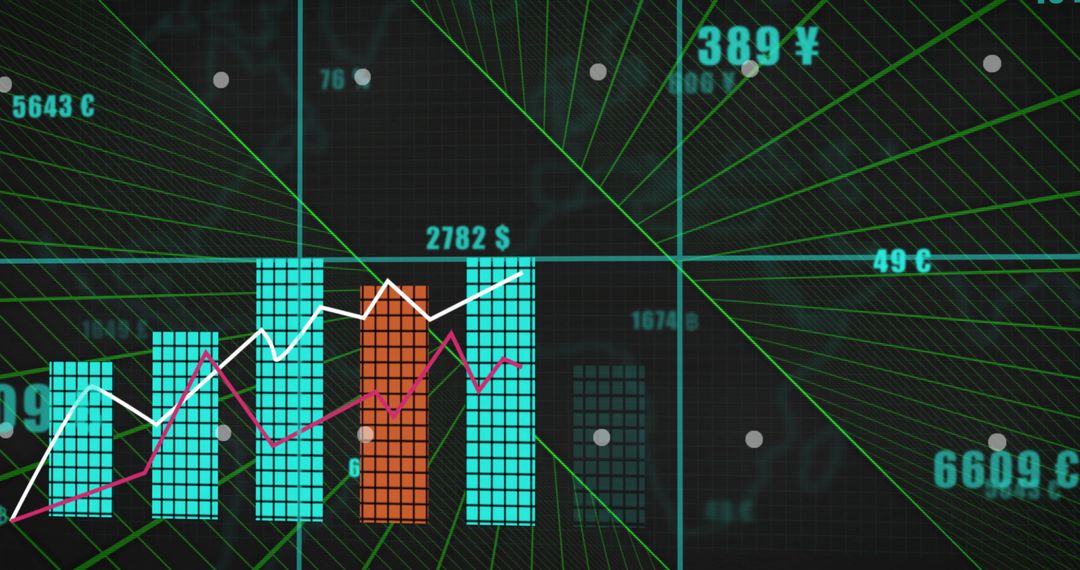
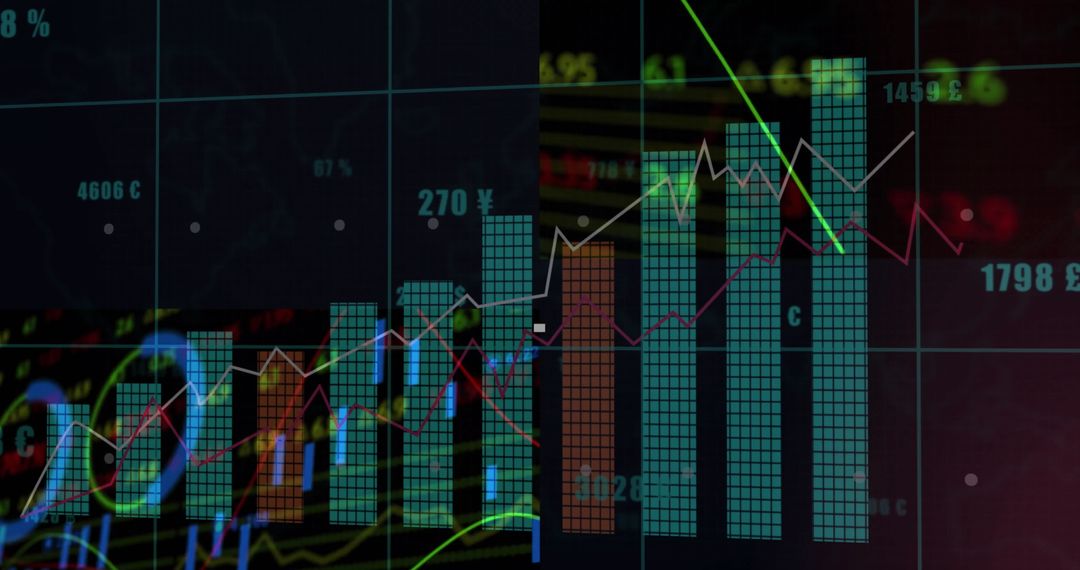
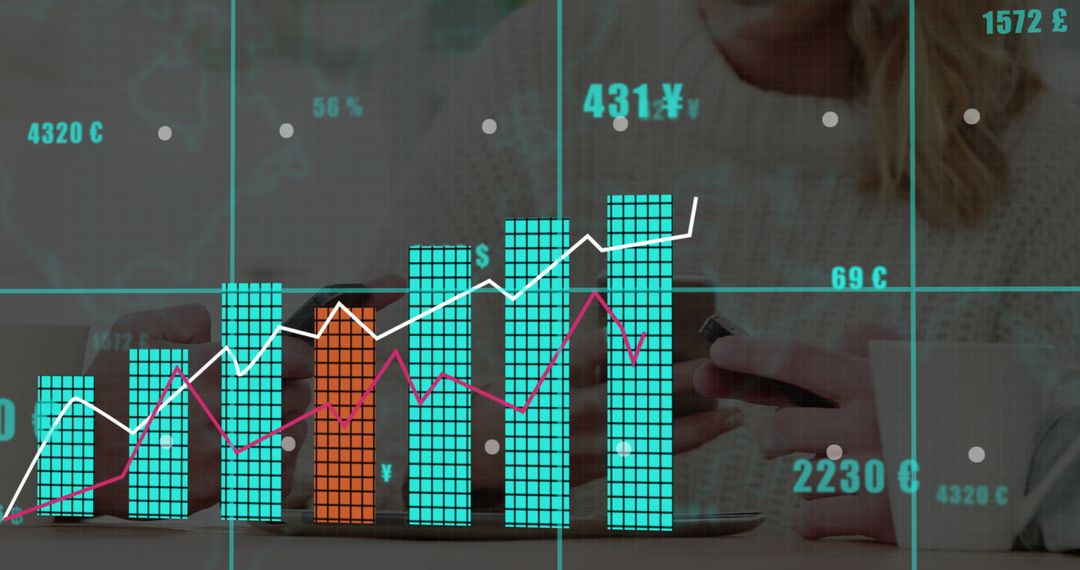
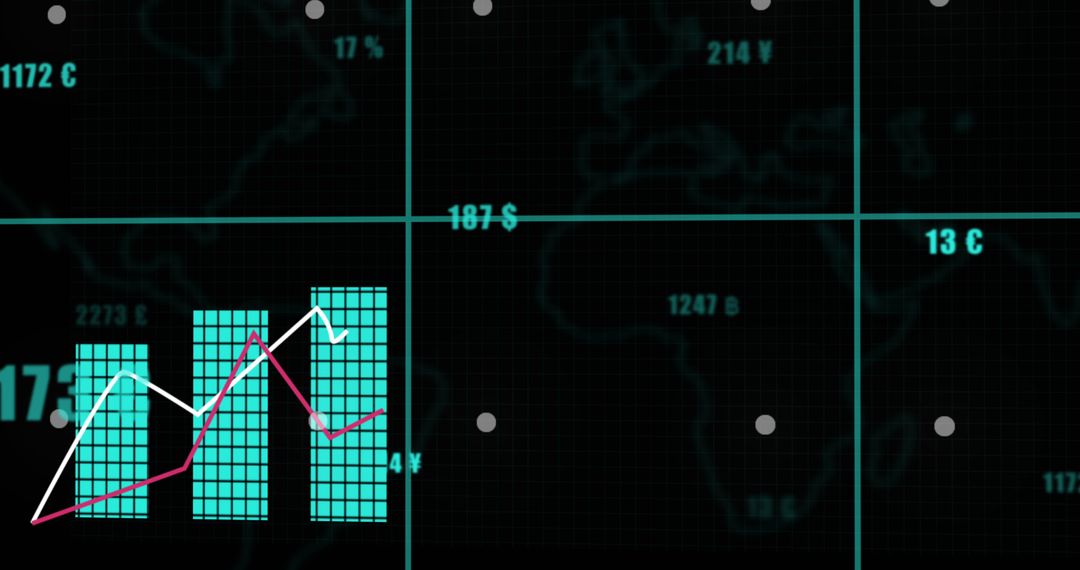
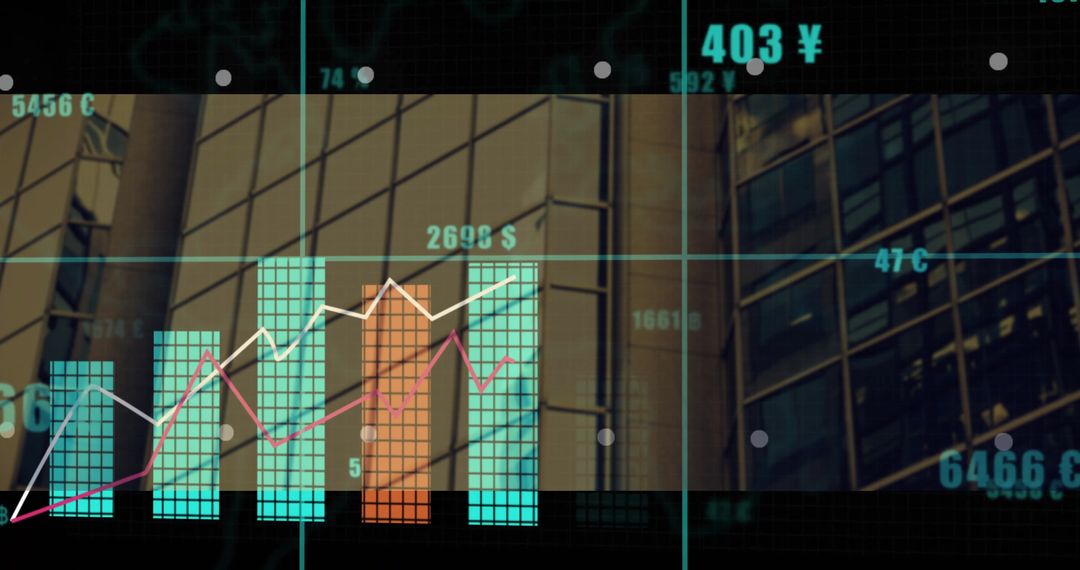
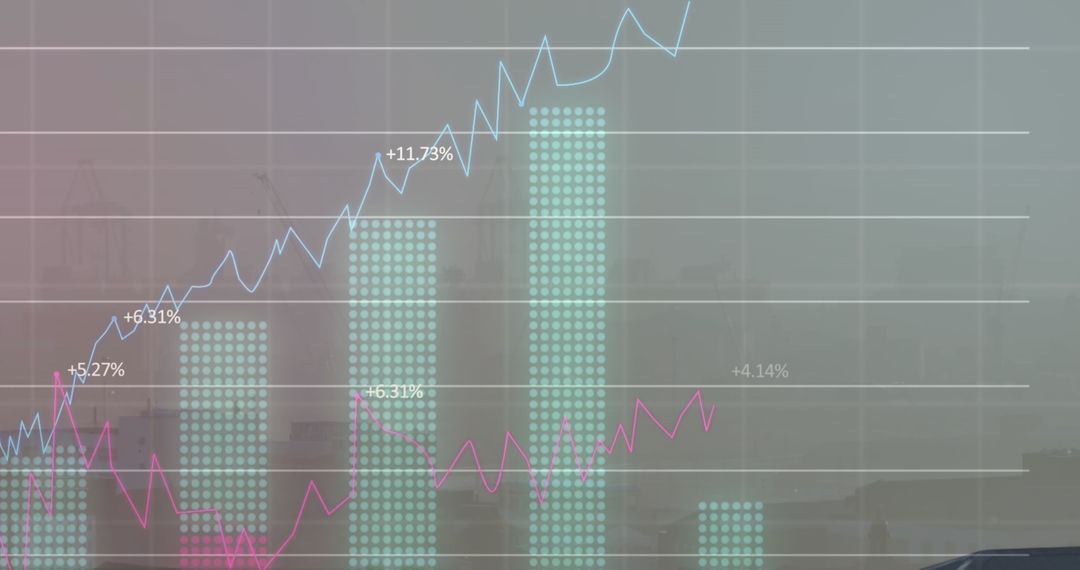
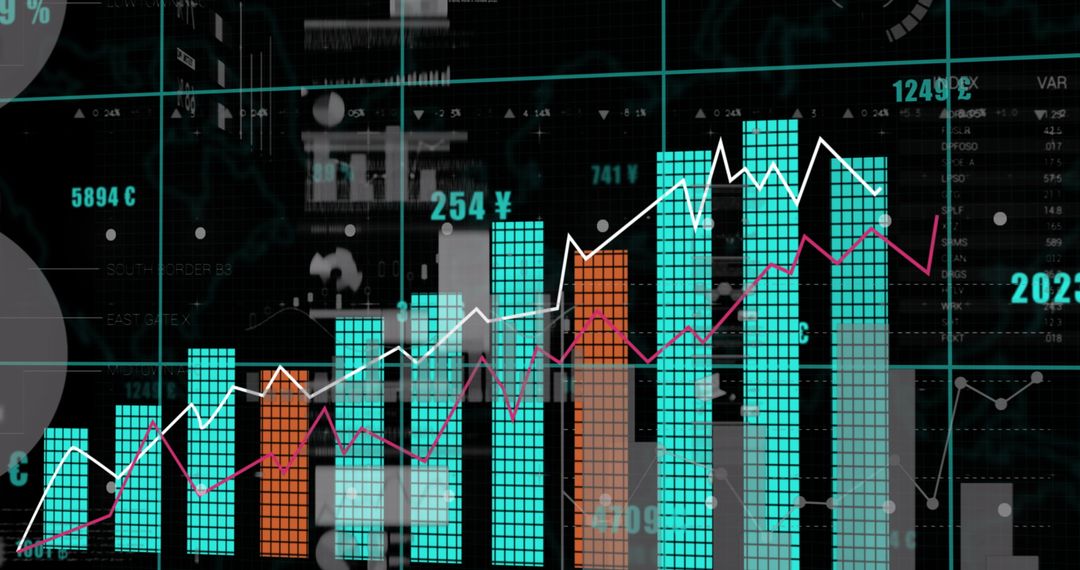
- Neon analytics displaying clustered bar chart with cyan bars, orange accent, trend lines
Neon analytics displaying clustered bar chart with cyan bars, orange accent, trend lines Image
Presenting neon analytics dashboard showing clustered bars in cyan with orange highlight and white and magenta trend lines over dark grid. High-contrast, futuristic look matching tech, finance, data branding. Suiting presentations, investor reports, fintech websites, social media posts, blog headers, marketing banners, UI mockups. Recommending cropping for hero banners or widescreen headers, placing bold headline on right side, adding semi-transparent panel for copy, animating trend lines for video intros. Color palette working well with teal, black and neon accents; considering applying color grading to match brand. Deliverable offering modern visual for communicating metrics, growth, comparison and performance trends.
Powered by  - Get 15% off with code: PIKWIZARD15


0
downloads
downloads
Tags:
More
Credit Photo
If you would like to credit the Photo, here are some ways you can do so
Text Link
photo Link
<span class="text-link">
<span>
<a target="_blank" href=https://pikwizard.com/photo/neon-analytics-displaying-clustered-bar-chart-with-cyan-bars-orange-accent-trend-lines/37507045ef9212249b7e682abbd2e20a/>PikWizard</a>
</span>
</span>
<span class="image-link">
<span
style="margin: 0 0 20px 0; display: inline-block; vertical-align: middle; width: 100%;"
>
<a
target="_blank"
href="https://pikwizard.com/photo/neon-analytics-displaying-clustered-bar-chart-with-cyan-bars-orange-accent-trend-lines/37507045ef9212249b7e682abbd2e20a/"
style="text-decoration: none; font-size: 10px; margin: 0;"
>
<img src="https://pikwizard.com/pw/medium/37507045ef9212249b7e682abbd2e20a.jpg" style="margin: 0; width: 100%;" alt="" />
<p style="font-size: 12px; margin: 0;">PikWizard</p>
</a>
</span>
</span>
Free (free of charge)
Free for personal and commercial use.
Author: Authentic Images
Similar Free Stock Images
Premium


Premium


Premium


Premium


Premium

Premium


Premium


Premium


Premium


Premium


Premium


Premium


Premium


Premium


Premium


Premium


Premium


Premium


Premium


Premium


Premium


Premium


Premium


Premium