- Home >
- Stock Photos >
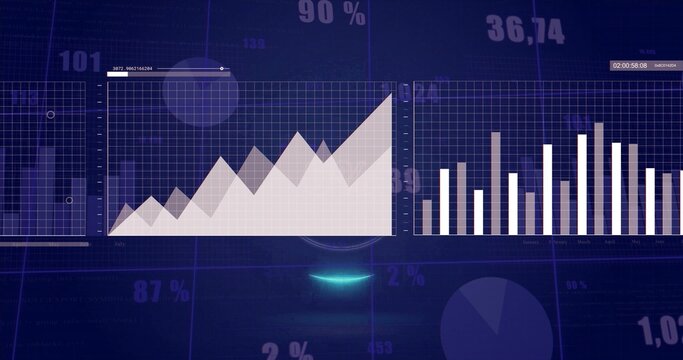
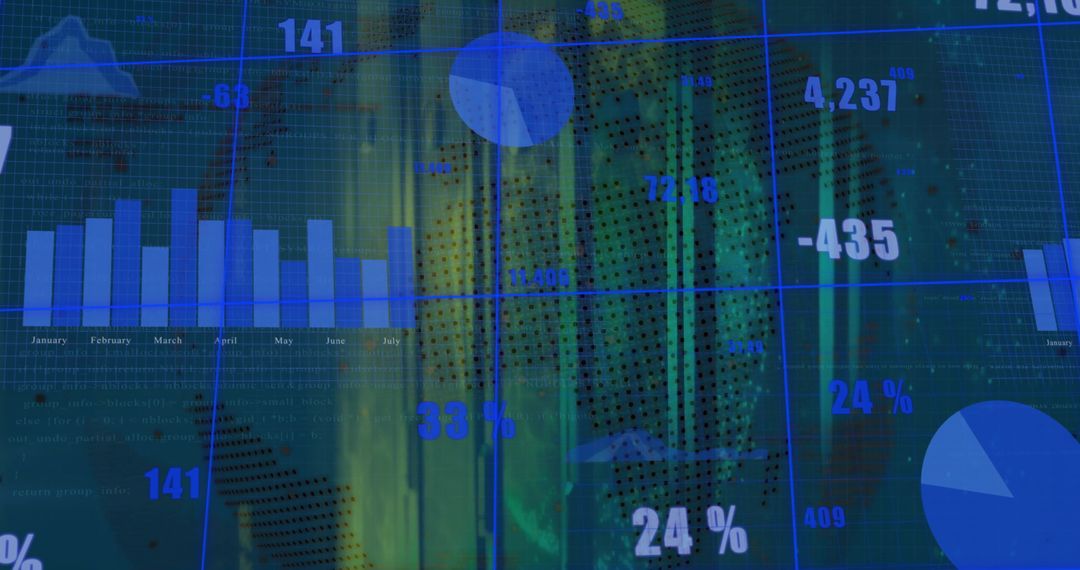
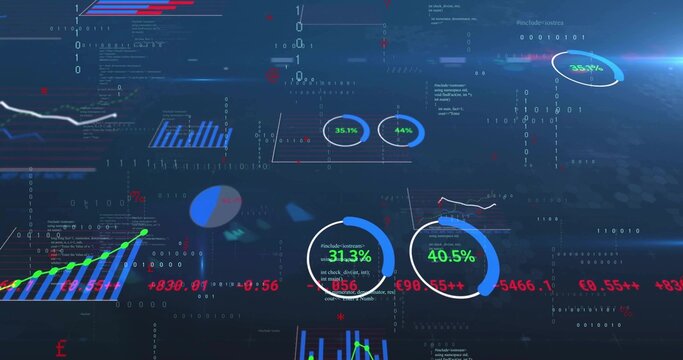
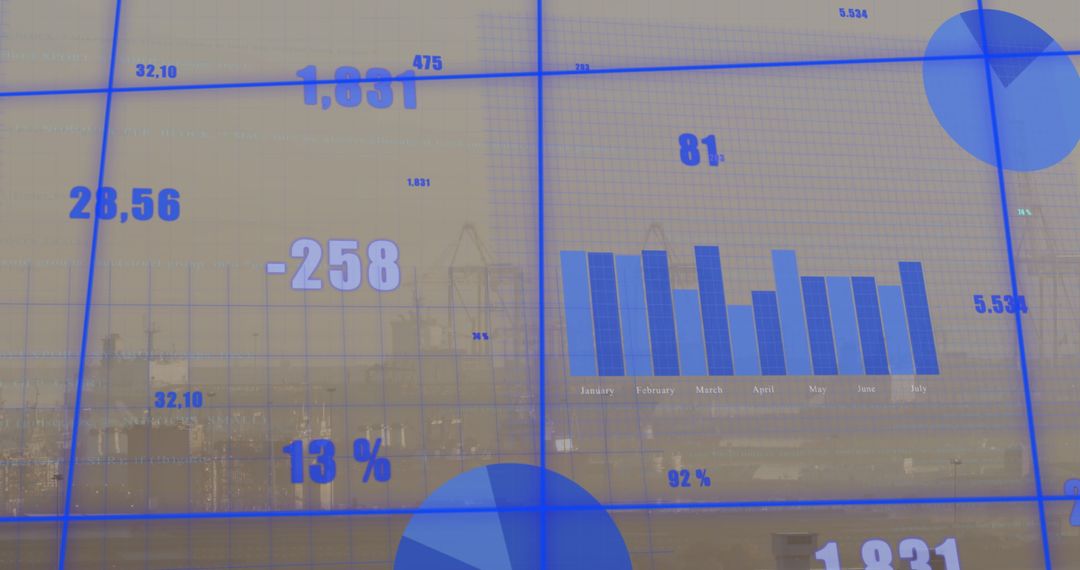
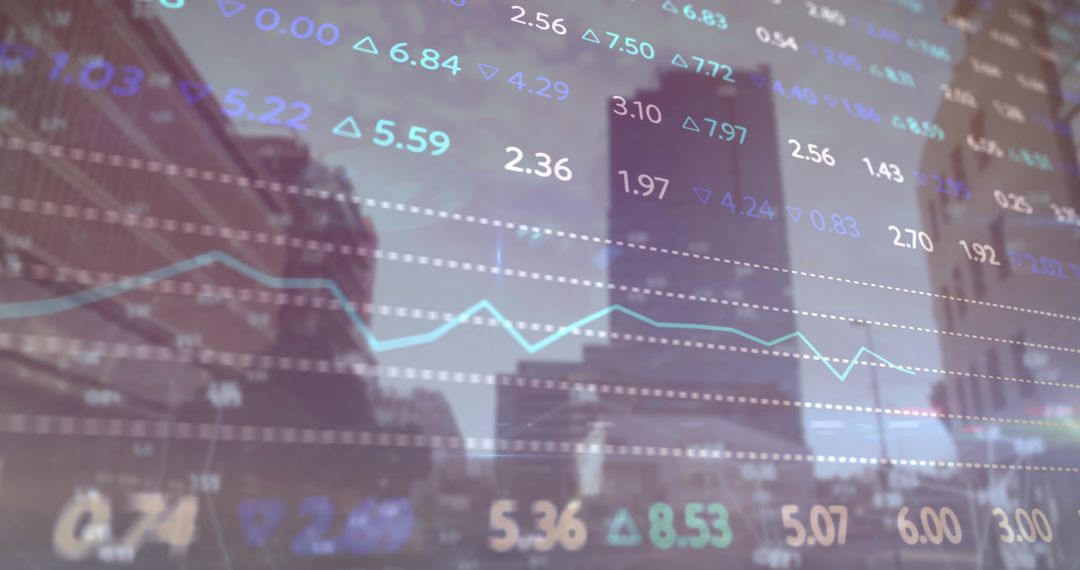
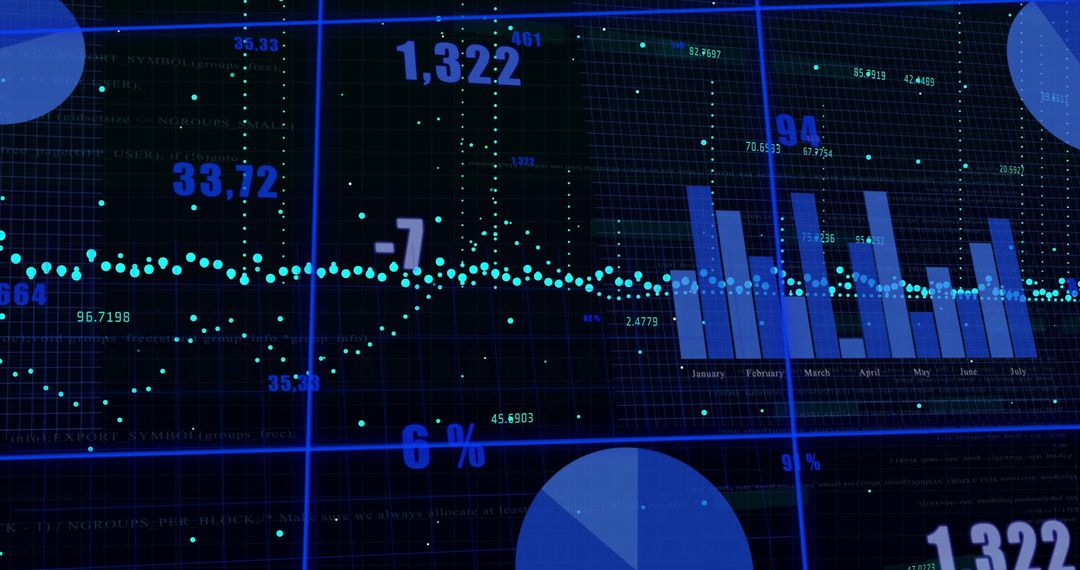
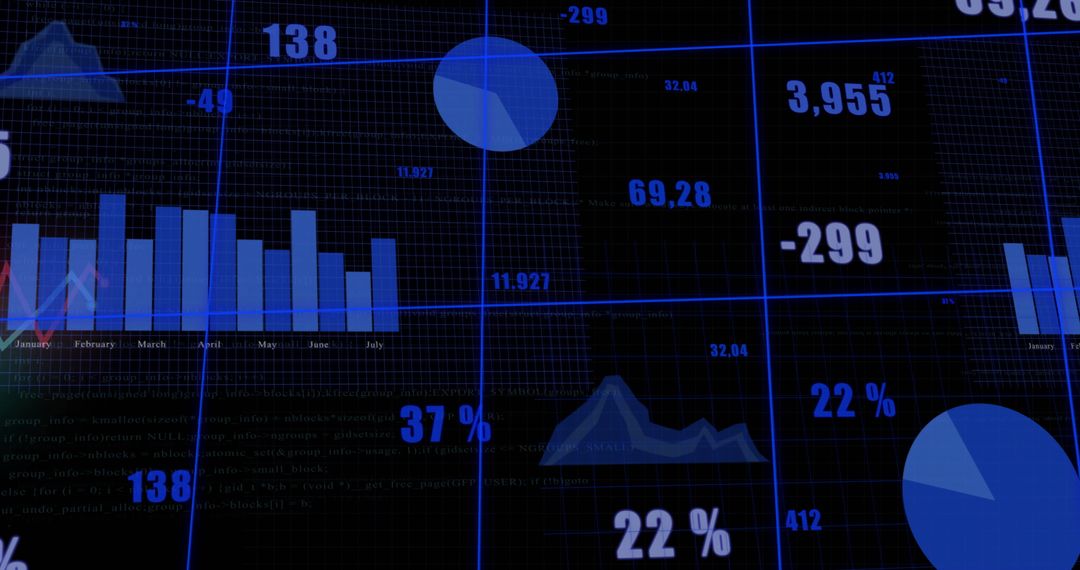
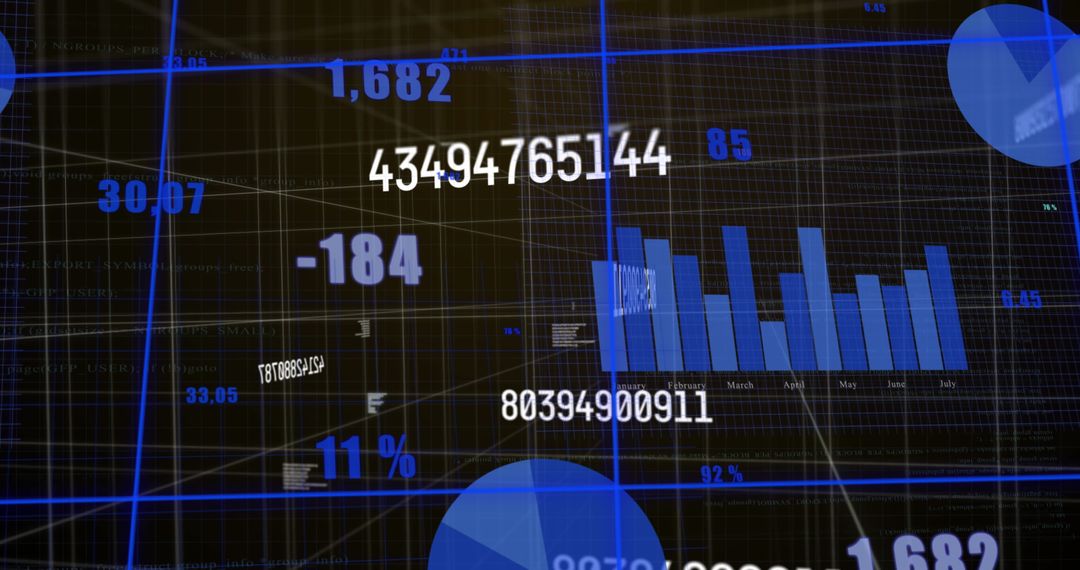
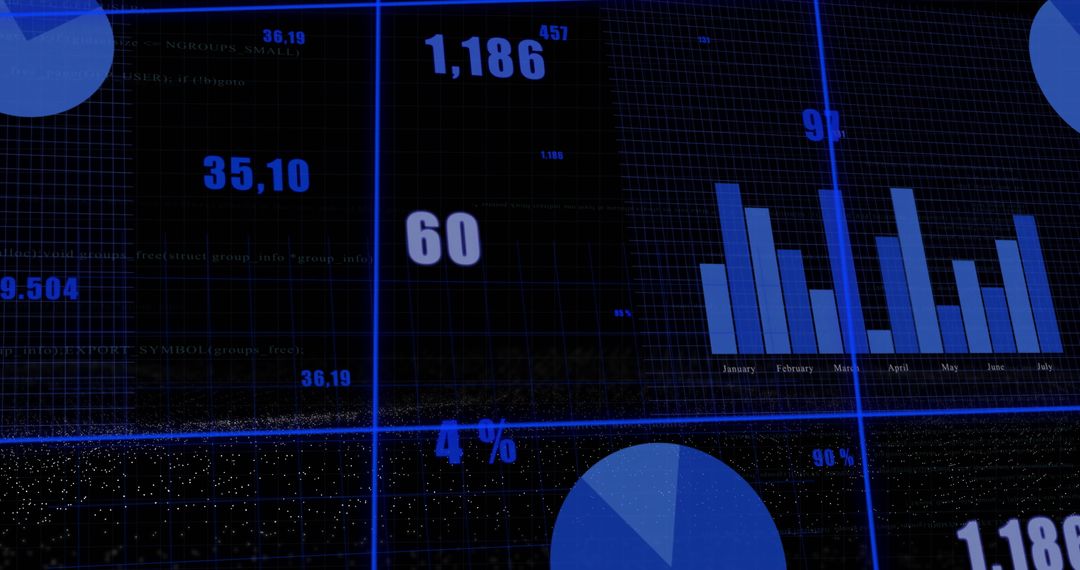
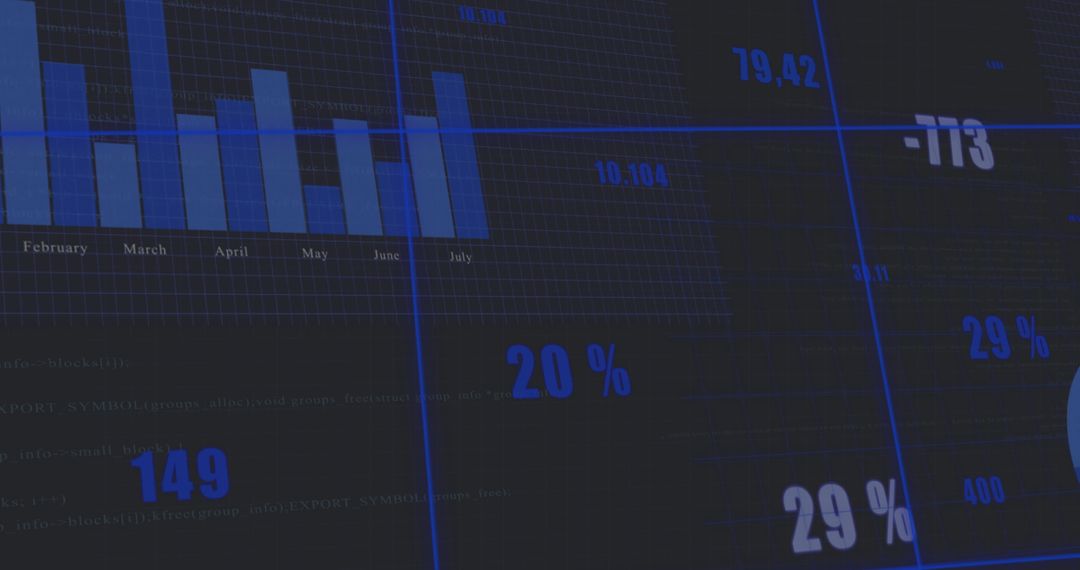
- Neon Blue Financial HUD Dashboard Displaying Bar Chart, Trend Line and Percentage Metrics
Neon Blue Financial HUD Dashboard Displaying Bar Chart, Trend Line and Percentage Metrics Image

Displaying neon blue HUD with vertical bars for February through July, plotting dotted trend line across dark grid, and highlighting percentage overlays and numeric KPIs. Using high-contrast blue palette and precise gridlines to convey tech-forward, data-driven mood for finance and analytics content. Ideal for hero banners, website backgrounds, presentation slides, investor reports, fintech app mockups, marketing materials, and social media campaigns. Supporting themes such as monthly performance, revenue trends, market analysis, KPI dashboards, and risk monitoring while leaving clear negative space for text and branding.
Powered by 


0
downloads
downloads
Tags:
More
Credit Photo
If you would like to credit the Photo, here are some ways you can do so
Text Link
photo Link
<span class="text-link">
<span>
<a target="_blank" href=https://pikwizard.com/photo/neon-blue-financial-hud-dashboard-displaying-bar-chart-trend-line-and-percentage-metrics/60c0d9fe96f6baa8ef067a2cab81032f/>PikWizard</a>
</span>
</span>
<span class="image-link">
<span
style="margin: 0 0 20px 0; display: inline-block; vertical-align: middle; width: 100%;"
>
<a
target="_blank"
href="https://pikwizard.com/photo/neon-blue-financial-hud-dashboard-displaying-bar-chart-trend-line-and-percentage-metrics/60c0d9fe96f6baa8ef067a2cab81032f/"
style="text-decoration: none; font-size: 10px; margin: 0;"
>
<img src="https://pikwizard.com/pw/medium/60c0d9fe96f6baa8ef067a2cab81032f.jpg" style="margin: 0; width: 100%;" alt="" />
<p style="font-size: 12px; margin: 0;">PikWizard</p>
</a>
</span>
</span>
Free (free of charge)
Free for personal and commercial use.
Author: People Creations
Similar Free Stock Images

Premium


Premium


Premium


Premium


Premium


Premium


Premium


Premium


Premium


Premium


Premium


Premium


Premium


Premium


Premium


Premium


Premium


Premium


Premium


Premium


Premium


Premium


Premium


Premium