- Home >
- Stock Photos >
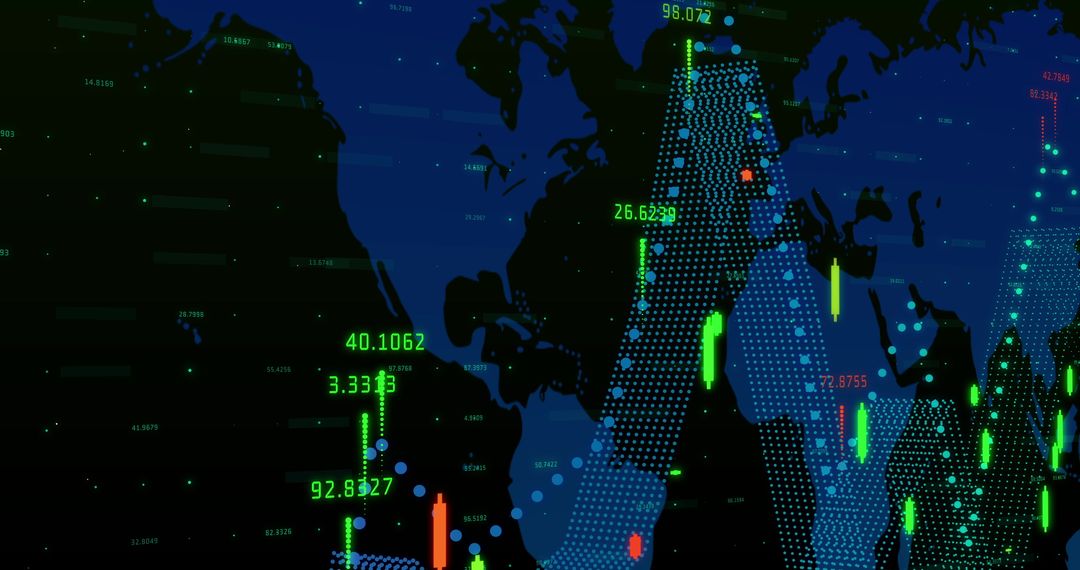
- Neon Blue Graph on Dynamic World Map Display
Neon Blue Graph on Dynamic World Map Display Image

Display showcasing neon blue line graph rising across world map, designed with green and red indicators representing data values. Illuminated lines suggest data movement, conveying technological advancement. Use for presentations on digital analytics, financial trends, technology innovations, or global commerce.
Powered by 


2
downloads
downloads
Tags:
More
Credit Photo
If you would like to credit the Photo, here are some ways you can do so
Text Link
photo Link
<span class="text-link">
<span>
<a target="_blank" href=https://pikwizard.com/photo/neon-blue-graph-on-dynamic-world-map-display/785ca91da81084f6f148025596883e71/>PikWizard</a>
</span>
</span>
<span class="image-link">
<span
style="margin: 0 0 20px 0; display: inline-block; vertical-align: middle; width: 100%;"
>
<a
target="_blank"
href="https://pikwizard.com/photo/neon-blue-graph-on-dynamic-world-map-display/785ca91da81084f6f148025596883e71/"
style="text-decoration: none; font-size: 10px; margin: 0;"
>
<img src="https://pikwizard.com/pw/medium/785ca91da81084f6f148025596883e71.jpg" style="margin: 0; width: 100%;" alt="" />
<p style="font-size: 12px; margin: 0;">PikWizard</p>
</a>
</span>
</span>
Free (free of charge)
Free for personal and commercial use.
Author: Awesome Content
Similar Free Stock Images
Premium


Premium


Premium


Premium


Premium


Premium


Premium


Premium


Premium


Premium


Premium


Premium


Premium


Premium


Premium


Premium


Premium


Premium


Premium


Premium


Premium


Premium


Premium


Premium