- Home >
- Stock Photos >
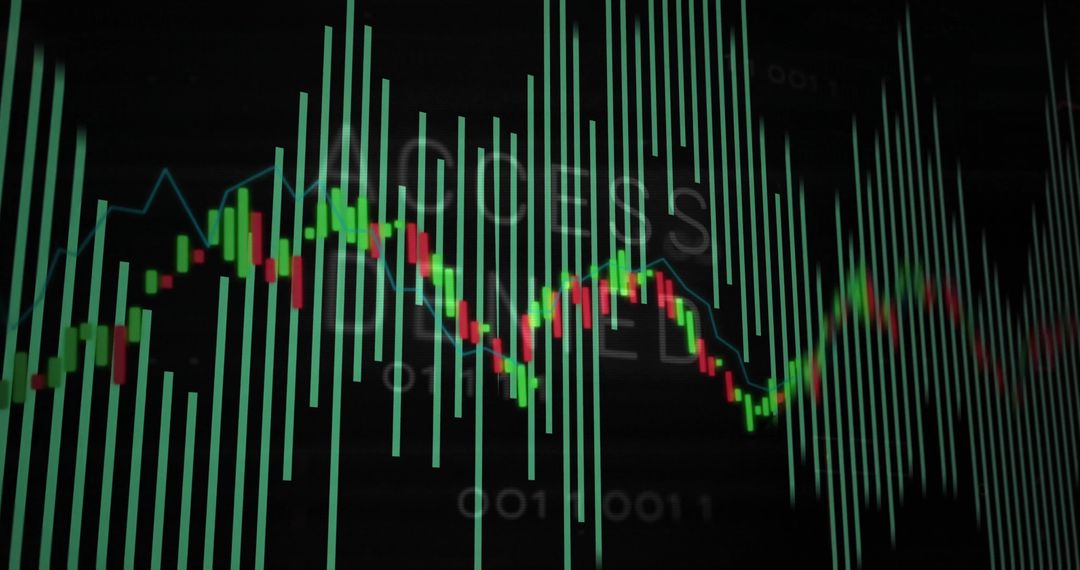
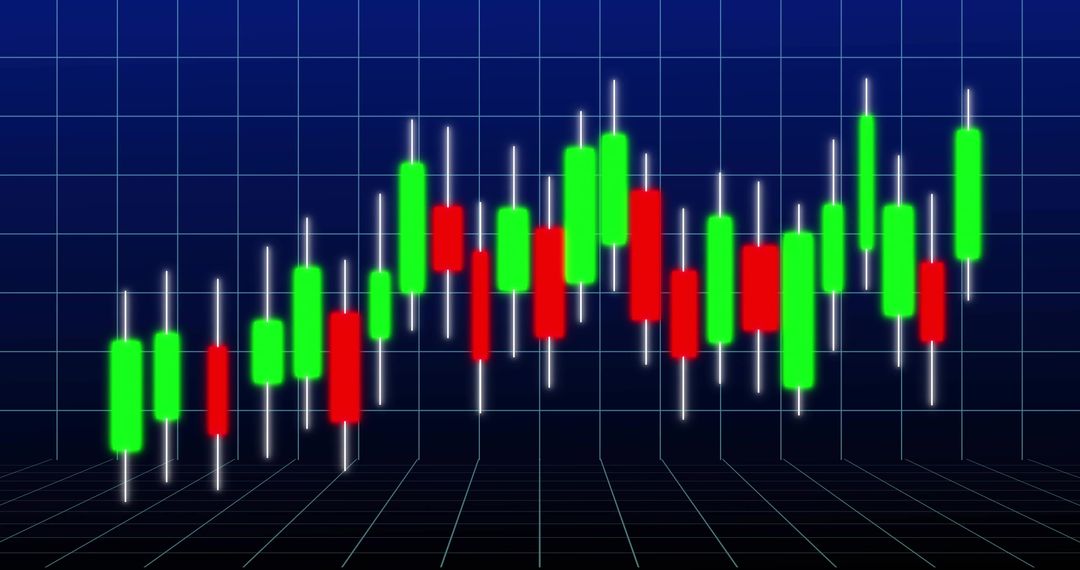
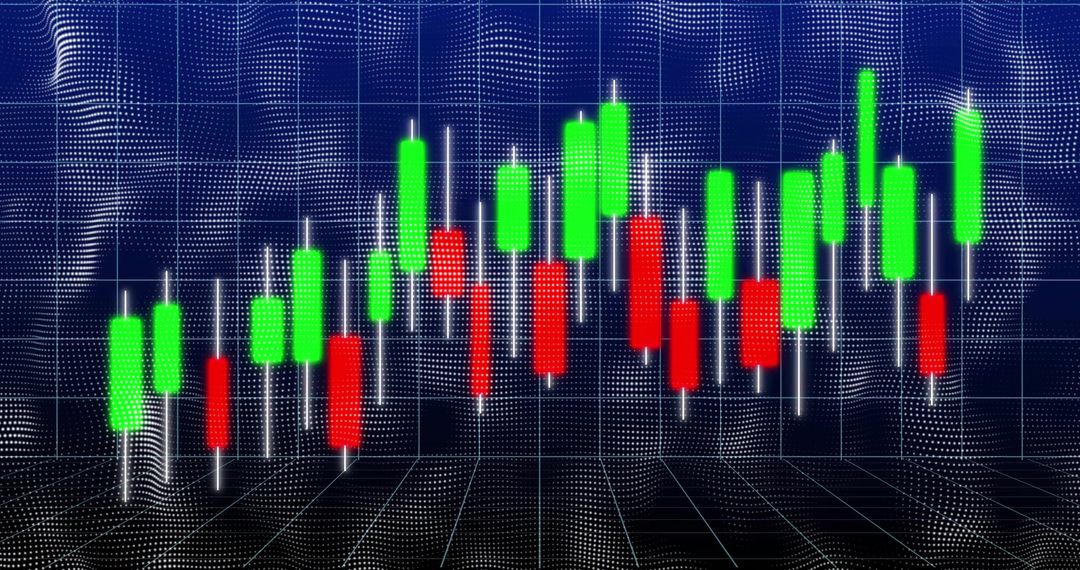
- Neon Candlestick Chart Displaying Green Red Bars with Glowing Wicks on 3D Grid
Neon Candlestick Chart Displaying Green Red Bars with Glowing Wicks on 3D Grid Image
Graphic showing candlestick chart with alternating green and red bars and glowing wicks set against deep blue 3D grid. Neon color palette and subtle perspective grid creating modern fintech aesthetic. Visualization highlighting price action, market volatility, bullish and bearish momentum for quick pattern recognition. Ideal for financial websites, trading blogs, investment presentations, market analysis reports, social media posts and advertising campaigns. Useful as hero banner, header background, slide illustration, infographic asset, UI concept or animated overlay for video. Easy to customize colors and add text overlays, data labels or branding elements for educational content, trading tutorials, market reports and promotional materials.
Powered by  - Get 15% off with code: PIKWIZARD15


0
downloads
downloads
Tags:
More
Credit Photo
If you would like to credit the Photo, here are some ways you can do so
Text Link
photo Link
<span class="text-link">
<span>
<a target="_blank" href=https://pikwizard.com/photo/neon-candlestick-chart-displaying-green-red-bars-with-glowing-wicks-on-3d-grid/0054824e6b2e242db564ef1ea5951645/>PikWizard</a>
</span>
</span>
<span class="image-link">
<span
style="margin: 0 0 20px 0; display: inline-block; vertical-align: middle; width: 100%;"
>
<a
target="_blank"
href="https://pikwizard.com/photo/neon-candlestick-chart-displaying-green-red-bars-with-glowing-wicks-on-3d-grid/0054824e6b2e242db564ef1ea5951645/"
style="text-decoration: none; font-size: 10px; margin: 0;"
>
<img src="https://pikwizard.com/pw/medium/0054824e6b2e242db564ef1ea5951645.jpg" style="margin: 0; width: 100%;" alt="" />
<p style="font-size: 12px; margin: 0;">PikWizard</p>
</a>
</span>
</span>
Free (free of charge)
Free for personal and commercial use.
Author: Creative Art
Similar Free Stock Images

Premium


Premium


Premium


Premium


Premium


Premium


Premium


Premium


Premium


Premium


Premium


Premium


Premium


Premium


Premium


Premium


Premium


Premium


Premium


Premium


Premium


Premium


Premium


Premium