
- Home >
- Stock Photos >
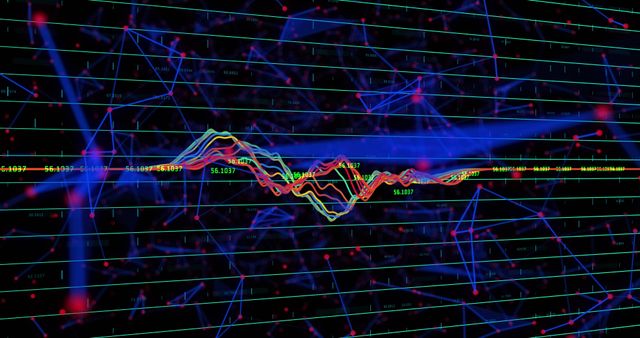
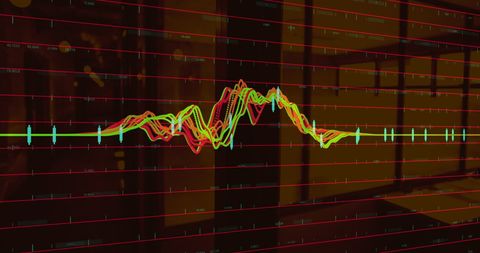
- Neon Candlestick Chart in Digital Trading Interface
Neon Candlestick Chart in Digital Trading Interface Image

AI
AI Generated Image. Vibrant digital rendering showcasing a neon candlestick chart with grid overlay against a dark background. Ideal for use in finance presentations, articles about digital analytics or technology in trading industries. Highlights advancements in financial technologies and can attract readers to topics about modern trading solutions.
Powered by  - Get 15% off with code: PIKWIZARD15


downloads
Tags:
More
Credit Photo
If you would like to credit the Photo, here are some ways you can do so
Text Link
photo Link
<span class="text-link">
<span>
<a target="_blank" href=https://pikwizard.com/photo/neon-candlestick-chart-in-digital-trading-interface/8a0c4fd0bc527a176c37e66965f9a754/>PikWizard</a>
</span>
</span>
<span class="image-link">
<span
style="margin: 0 0 20px 0; display: inline-block; vertical-align: middle; width: 100%;"
>
<a
target="_blank"
href="https://pikwizard.com/photo/neon-candlestick-chart-in-digital-trading-interface/8a0c4fd0bc527a176c37e66965f9a754/"
style="text-decoration: none; font-size: 10px; margin: 0;"
>
<img src="https://pikwizard.com/pw/medium/8a0c4fd0bc527a176c37e66965f9a754.jpg" style="margin: 0; width: 100%;" alt="" />
<p style="font-size: 12px; margin: 0;">PikWizard</p>
</a>
</span>
</span>
Free (free of charge)
Free for personal and commercial use.
Author: AI Creator
Similar Free Stock Images

Premium


Premium
AI


Premium

Premium


AI

Premium


Premium

Premium


Premium


Premium

Premium

Premium

Premium


Premium


Premium

Premium

AI

AI


Premium

Premium


Premium


AI


AI

AI


Premium

AI

Premium

Premium


AI


Premium

AI


AI


Premium

AI


Premium

Premium

Explore More Free Stock Images