- Home >
- Stock Photos >
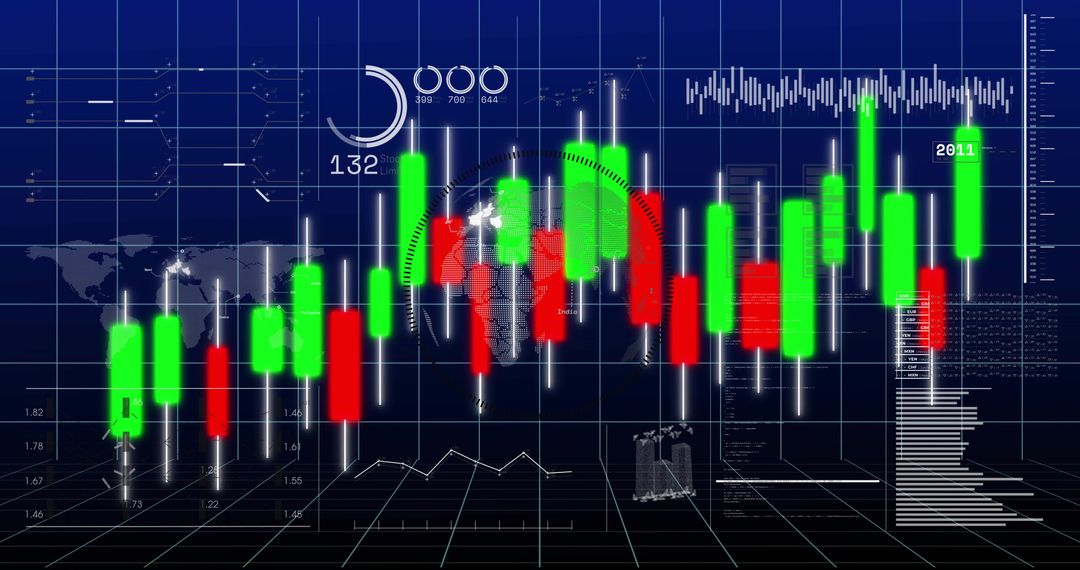
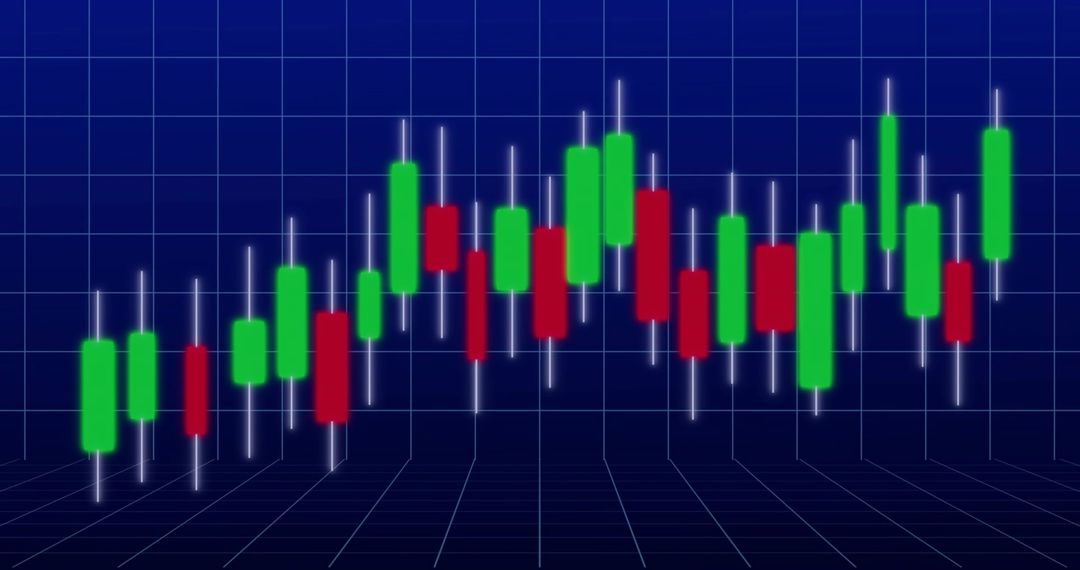
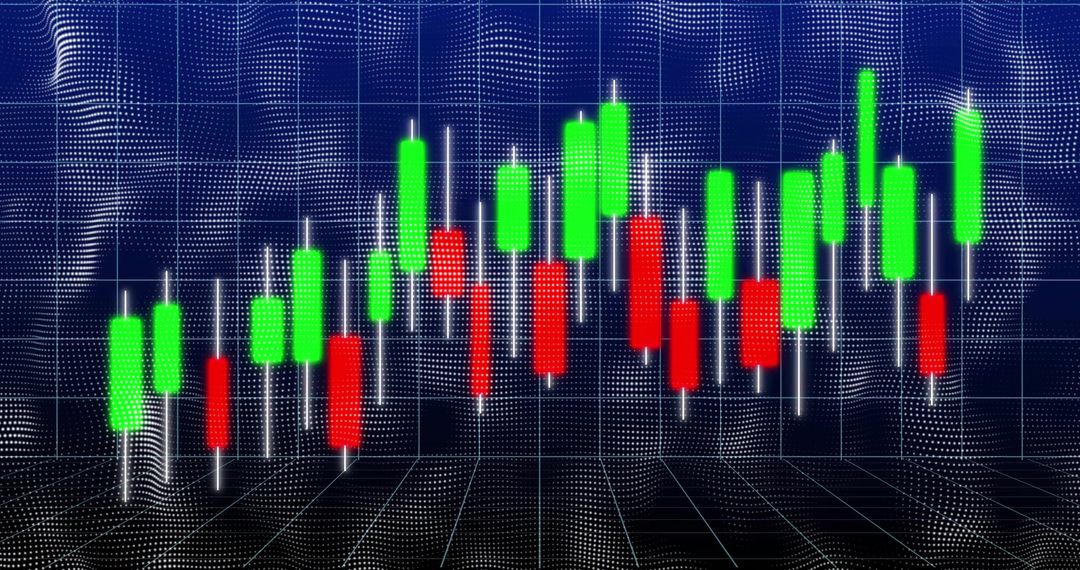
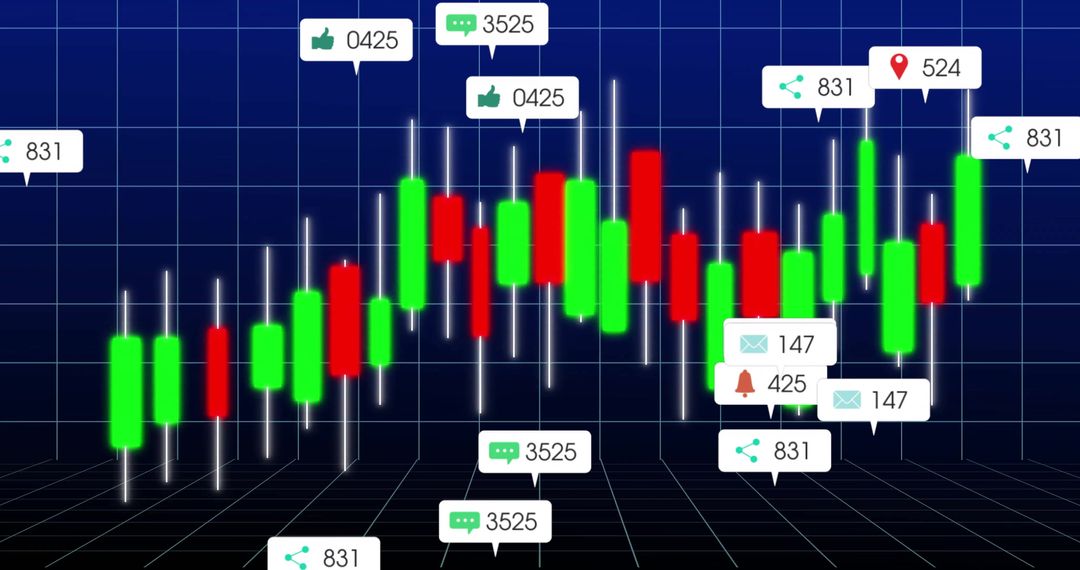
- Neon Candlestick Chart Showing Green and Red Trading Bars on Dark Grid
Neon Candlestick Chart Showing Green and Red Trading Bars on Dark Grid Image

Presenting neon candlestick chart with alternating green and red bars and white wicks on dark blue grid. Featuring 3D perspective grid and glowing neon colors for high-tech visual impact. Highlighting upward and downward market movement suitable for trading, investment, finance, cryptocurrency and forex themes. Serving as striking hero graphic for fintech websites, trading platform interfaces, blog posts on market analysis, presentation slides for investment strategies, social media ads and newsletter headers. Providing wide horizontal layout with negative space for headline or call-to-action overlay and strong contrast for clear text legibility. Pairing well with bold sans-serif typography, data-driven layouts and animated transitions for video intros or app headers.
Powered by 


0
downloads
downloads
Tags:
More
Credit Photo
If you would like to credit the Photo, here are some ways you can do so
Text Link
photo Link
<span class="text-link">
<span>
<a target="_blank" href=https://pikwizard.com/photo/neon-candlestick-chart-showing-green-and-red-trading-bars-on-dark-grid/f0dc8285a02f5814a7404300510d696c/>PikWizard</a>
</span>
</span>
<span class="image-link">
<span
style="margin: 0 0 20px 0; display: inline-block; vertical-align: middle; width: 100%;"
>
<a
target="_blank"
href="https://pikwizard.com/photo/neon-candlestick-chart-showing-green-and-red-trading-bars-on-dark-grid/f0dc8285a02f5814a7404300510d696c/"
style="text-decoration: none; font-size: 10px; margin: 0;"
>
<img src="https://pikwizard.com/pw/medium/f0dc8285a02f5814a7404300510d696c.jpg" style="margin: 0; width: 100%;" alt="" />
<p style="font-size: 12px; margin: 0;">PikWizard</p>
</a>
</span>
</span>
Free (free of charge)
Free for personal and commercial use.
Author: People Creations
Similar Free Stock Images

Premium


Premium


Premium


Premium


Premium


Premium


Premium


Premium


Premium


Premium


Premium


Premium


Premium


Premium


Premium


Premium


Premium


Premium


Premium


Premium


Premium


Premium


Premium


Premium