- Home >
- Stock Photos >
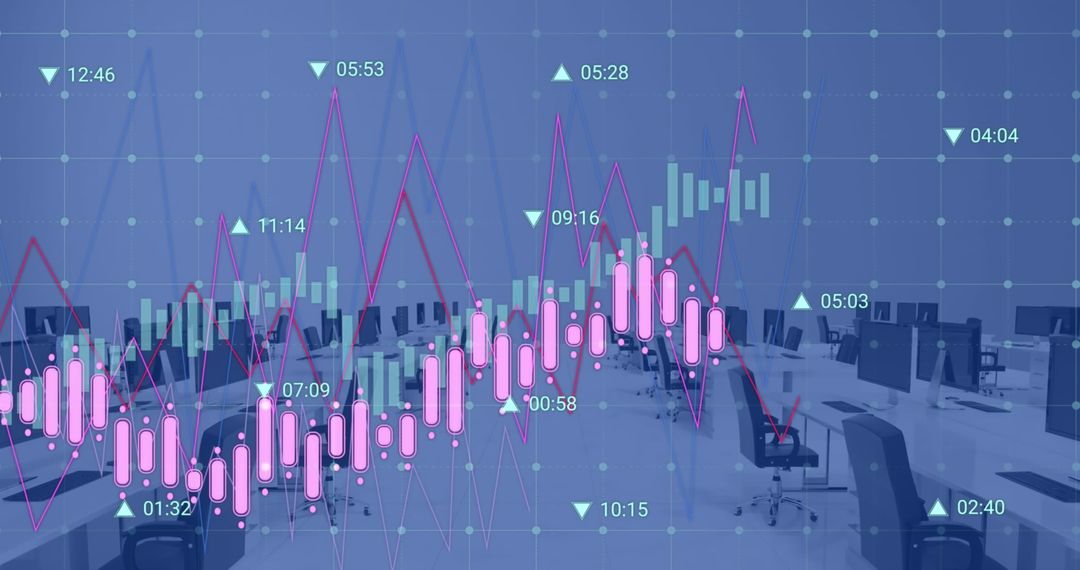
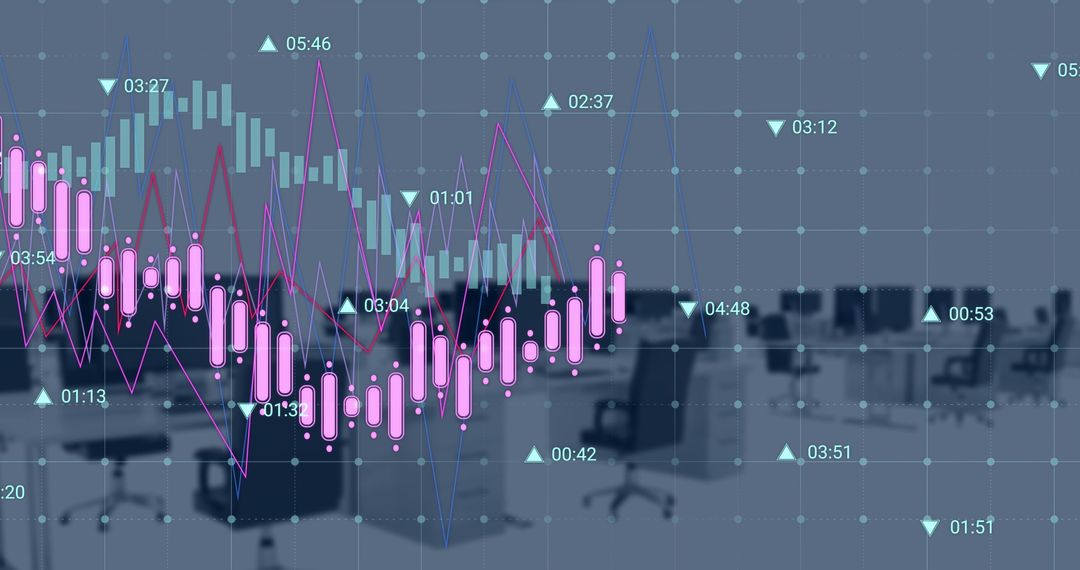
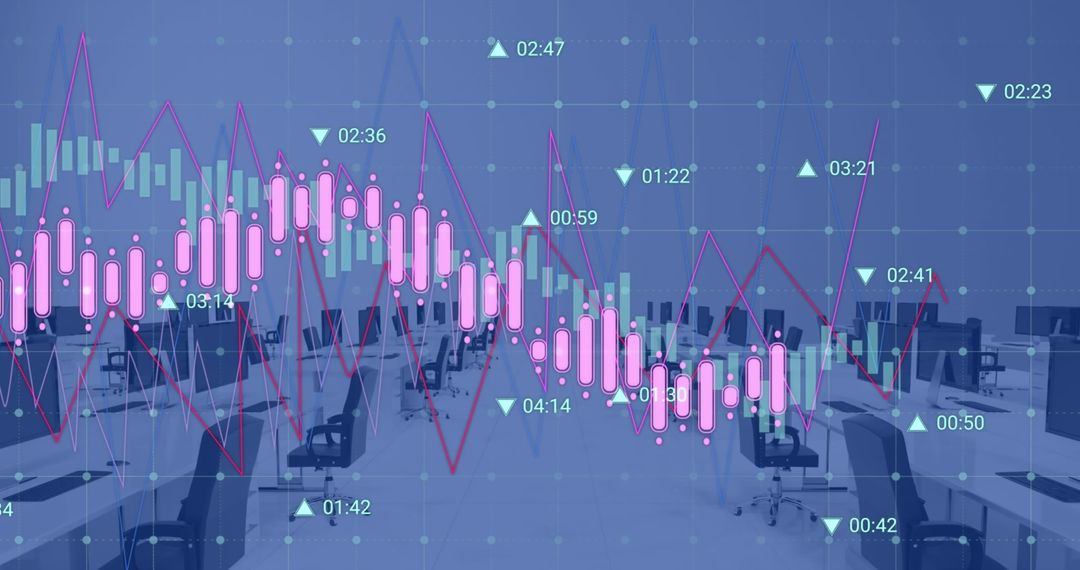
- Neon Candlestick Chart Visualizing Stock Market Data with Glowing Lines, Magenta Markers
Neon Candlestick Chart Visualizing Stock Market Data with Glowing Lines, Magenta Markers Image

Visualizing candlestick data with glowing lines and magenta markers, creating futuristic finance aesthetic. Enhancing fintech dashboards, trading platform mockups, investment reports, and market analysis slides. Supporting blog headers, social media posts, landing pages, and email campaigns for financial services and trading education. Emphasizing volatility, trend analysis, and technical indicators for use in investor presentations and data storytelling. Offering high-contrast neon palette ideal for modern UI design, marketing materials, and editorial layouts.
Powered by 


0
downloads
downloads
Tags:
More
Credit Photo
If you would like to credit the Photo, here are some ways you can do so
Text Link
photo Link
<span class="text-link">
<span>
<a target="_blank" href=https://pikwizard.com/photo/neon-candlestick-chart-visualizing-stock-market-data-with-glowing-lines-magenta-markers/6304d4e40fd134d14521e90fa28f7ceb/>PikWizard</a>
</span>
</span>
<span class="image-link">
<span
style="margin: 0 0 20px 0; display: inline-block; vertical-align: middle; width: 100%;"
>
<a
target="_blank"
href="https://pikwizard.com/photo/neon-candlestick-chart-visualizing-stock-market-data-with-glowing-lines-magenta-markers/6304d4e40fd134d14521e90fa28f7ceb/"
style="text-decoration: none; font-size: 10px; margin: 0;"
>
<img src="https://pikwizard.com/pw/medium/6304d4e40fd134d14521e90fa28f7ceb.jpg" style="margin: 0; width: 100%;" alt="" />
<p style="font-size: 12px; margin: 0;">PikWizard</p>
</a>
</span>
</span>
Free (free of charge)
Free for personal and commercial use.
Author: People Creations
Similar Free Stock Images

Premium


Premium


Premium


Premium


Premium


Premium


Premium


Premium


Premium


Premium


Premium


Premium


Premium


Premium


Premium


Premium


Premium


Premium


Premium


Premium


Premium


Premium


Premium


Premium