- Home >
- Stock Photos >
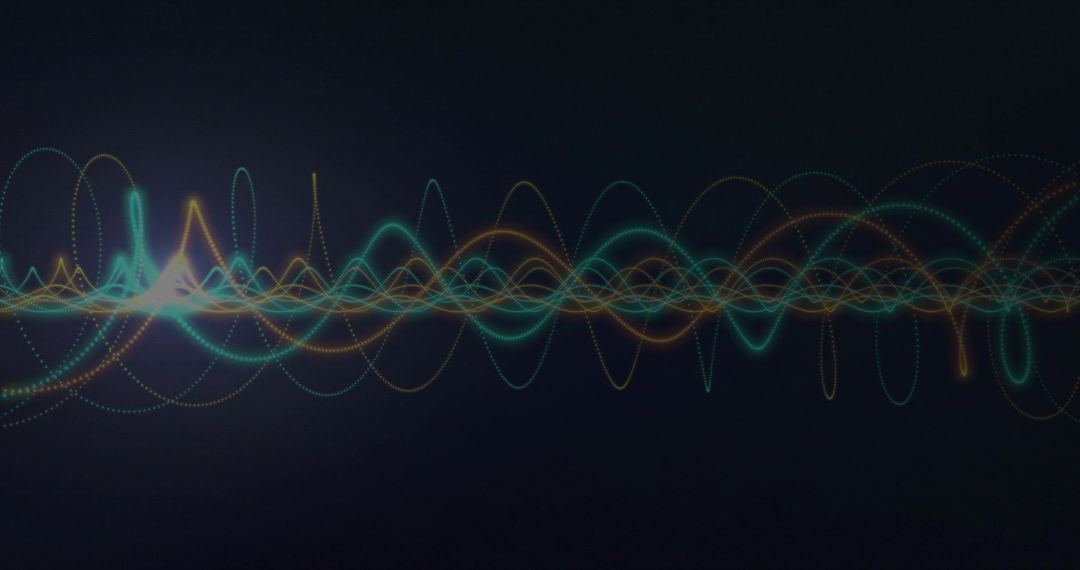
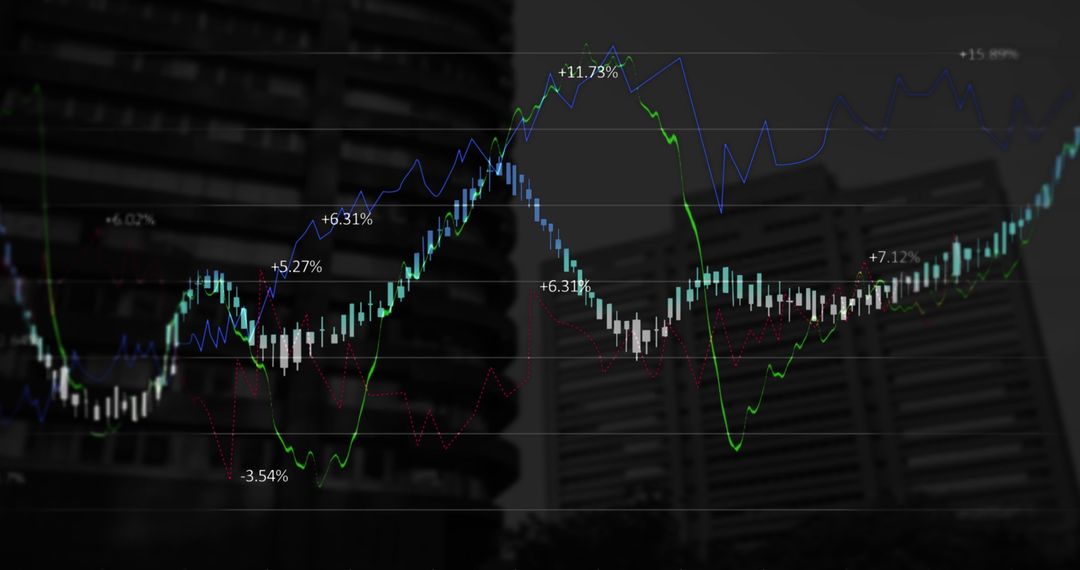
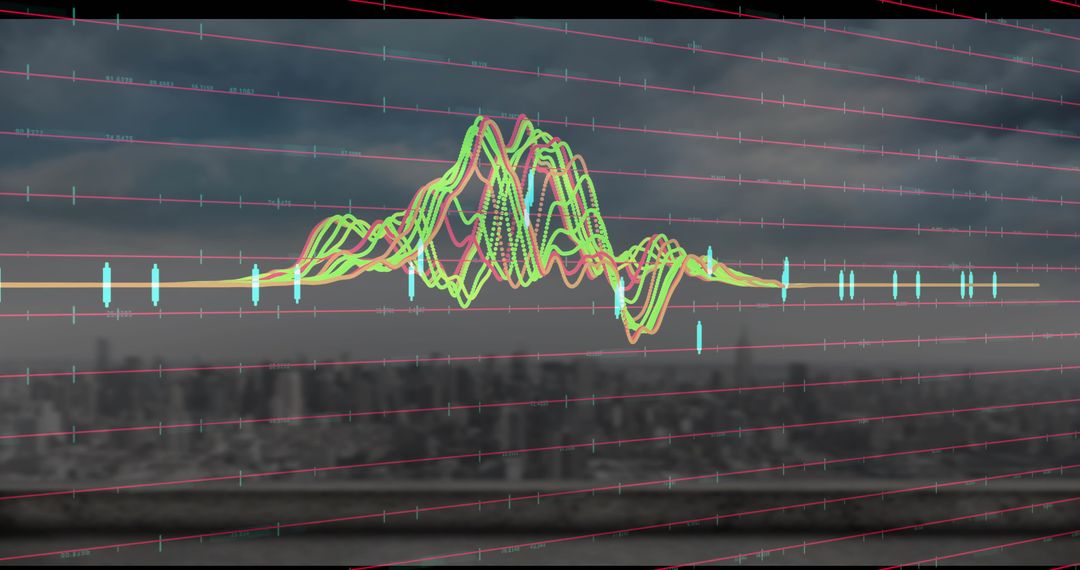
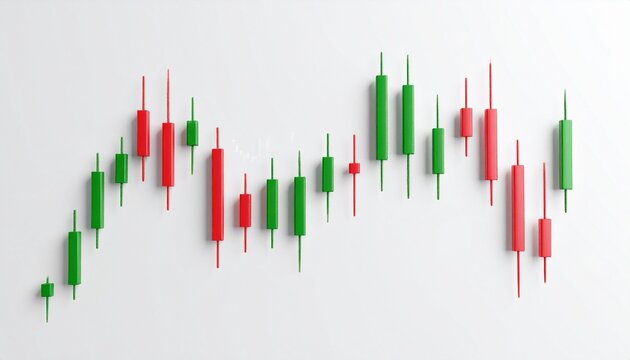
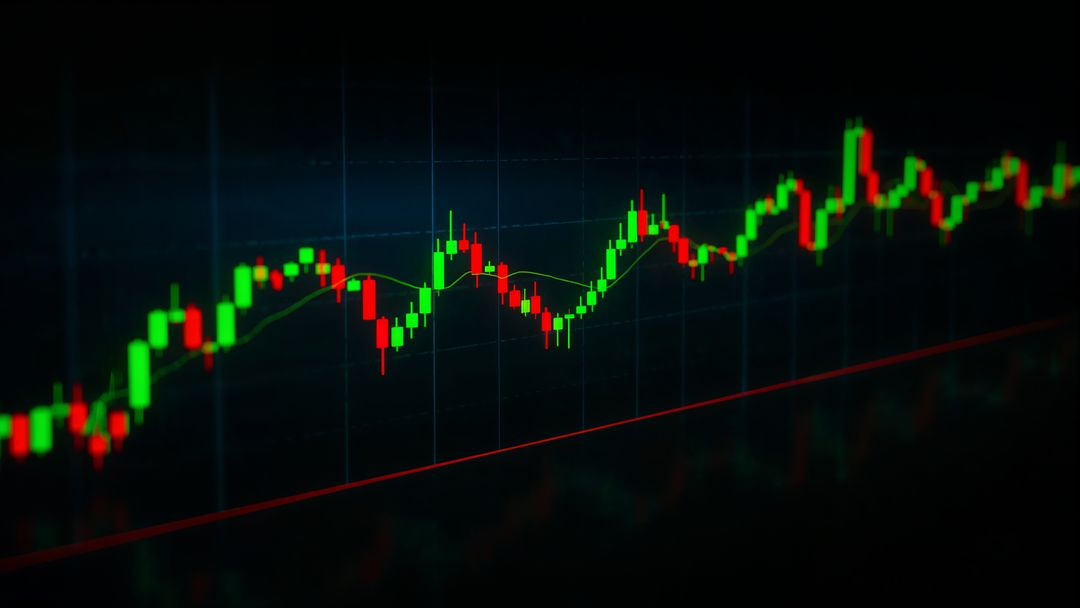
- Neon Candlestick Chart with Blue and Green Trend Lines and Percent Labels, Volatility
Neon Candlestick Chart with Blue and Green Trend Lines and Percent Labels, Volatility Image

Dark neon candlestick chart showing teal candlesticks, blue and green trend lines, percent labels and diagonal grid overlay. High contrast composition conveying volatility, time series movement and data-driven analytics. Serving as strong visual for financial presentations, market reports, trading platform interfaces, fintech landing pages, social media posts and business blogs. Use for illustrating market volatility, performance comparison, technical analysis, investment strategy visuals and risk management messaging. Space available for headline copy, logo placement and data callouts. Suitable for widescreen banners, slide decks, website hero sections and print marketing.
Powered by 


0
downloads
downloads
Tags:
More
Credit Photo
If you would like to credit the Photo, here are some ways you can do so
Text Link
photo Link
<span class="text-link">
<span>
<a target="_blank" href=https://pikwizard.com/photo/neon-candlestick-chart-with-blue-and-green-trend-lines-and-percent-labels-volatility/a34629cae3e9cde5f32e8ee4e8c55d22/>PikWizard</a>
</span>
</span>
<span class="image-link">
<span
style="margin: 0 0 20px 0; display: inline-block; vertical-align: middle; width: 100%;"
>
<a
target="_blank"
href="https://pikwizard.com/photo/neon-candlestick-chart-with-blue-and-green-trend-lines-and-percent-labels-volatility/a34629cae3e9cde5f32e8ee4e8c55d22/"
style="text-decoration: none; font-size: 10px; margin: 0;"
>
<img src="https://pikwizard.com/pw/medium/a34629cae3e9cde5f32e8ee4e8c55d22.jpg" style="margin: 0; width: 100%;" alt="" />
<p style="font-size: 12px; margin: 0;">PikWizard</p>
</a>
</span>
</span>
Free (free of charge)
Free for personal and commercial use.
Author: Awesome Content
Similar Free Stock Images
Premium


Premium


Premium


Premium


Premium


Premium


Premium


Premium


Premium


Premium


Premium


Premium


Premium


Premium


Premium


Premium


Premium


Premium


Premium


Premium


Premium


Premium


Premium


Premium