
- Home >
- Stock Photos >
- Neon Candlestick Market Dashboard Showing Real-Time Financial Data and Trading Analytics Visualizati
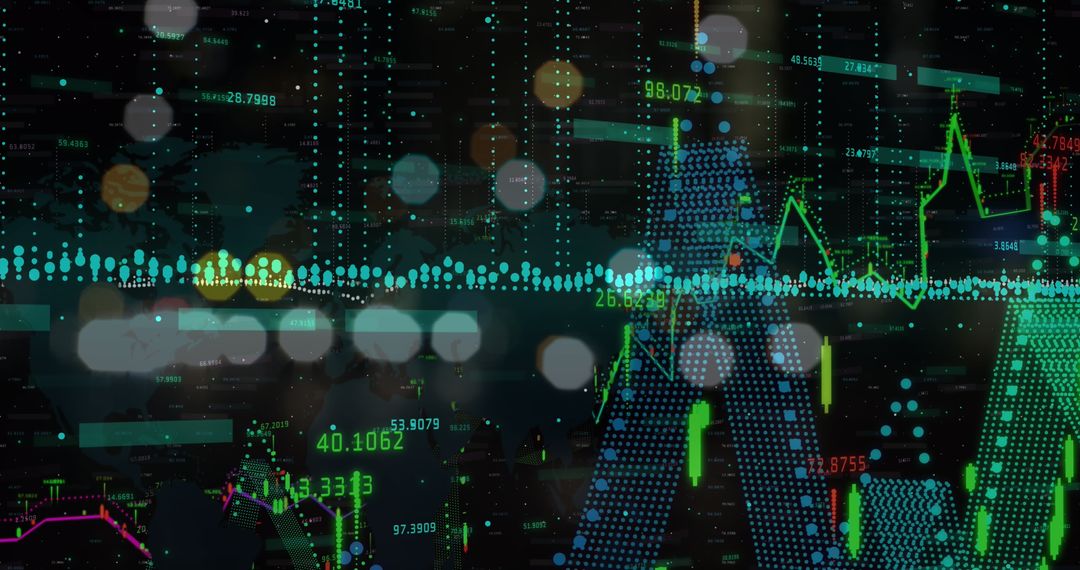
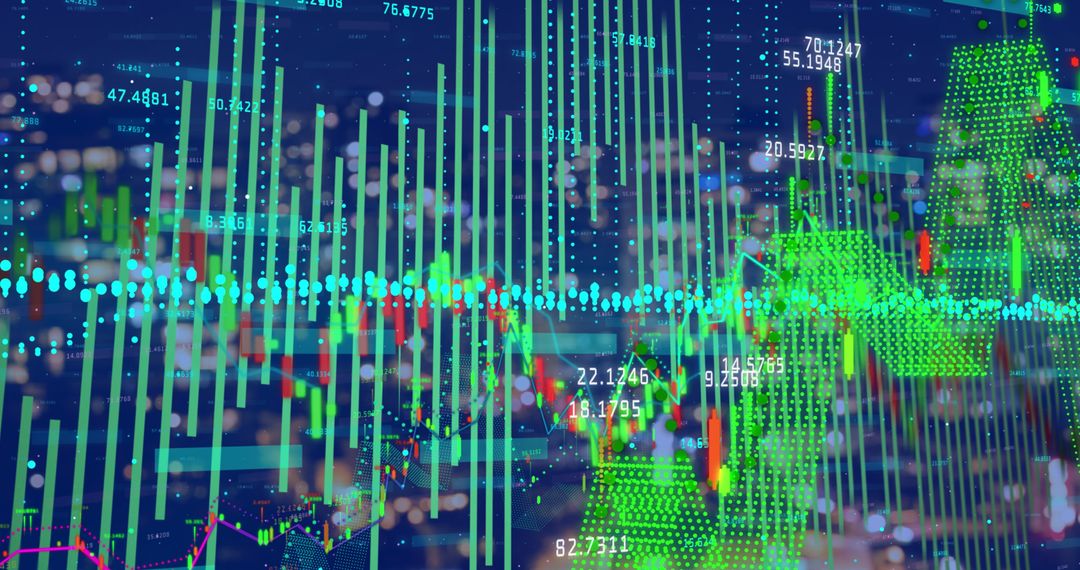
Neon Candlestick Market Dashboard Showing Real-Time Financial Data and Trading Analytics Visualizati Image

Presenting neon candlestick overlays on numeric ticker background, conveying high-tech finance environment. Ideal for illustrating market trends, trading strategies, real-time analytics dashboards, fintech landing pages, investor reports, and corporate board presentations. Working well as hero header for financial websites, blog post headers about stock analysis, slide deck visuals for earnings calls, app interface mockups for trading platforms, and marketing materials for fintech services. Offering strong blue and green neon tones and clear candlestick patterns for easy cropping and overlaying of text or UI elements. Providing versatile horizontal composition for banners, headers, social media covers, and editorial layouts.
Powered by  - Get 15% off with code: PIKWIZARD15


0
downloads
downloads
Tags:
More
Credit Photo
If you would like to credit the Photo, here are some ways you can do so
Text Link
photo Link
<span class="text-link">
<span>
<a target="_blank" href=https://pikwizard.com/photo/neon-candlestick-market-dashboard-showing-real-time-financial-data-and-trading-analytics-visualizati/2f8cdeb301562018d3744343bb0a498c/>PikWizard</a>
</span>
</span>
<span class="image-link">
<span
style="margin: 0 0 20px 0; display: inline-block; vertical-align: middle; width: 100%;"
>
<a
target="_blank"
href="https://pikwizard.com/photo/neon-candlestick-market-dashboard-showing-real-time-financial-data-and-trading-analytics-visualizati/2f8cdeb301562018d3744343bb0a498c/"
style="text-decoration: none; font-size: 10px; margin: 0;"
>
<img src="https://pikwizard.com/pw/medium/2f8cdeb301562018d3744343bb0a498c.jpg" style="margin: 0; width: 100%;" alt="" />
<p style="font-size: 12px; margin: 0;">PikWizard</p>
</a>
</span>
</span>
Free (free of charge)
Free for personal and commercial use.
Author: Creative Art
Similar Free Stock Images

Premium


Premium


Premium


Premium


Premium


Premium


Premium


Premium


Premium


Premium


Premium


Premium


Premium


Premium


Premium


Premium


Premium


Premium


Premium


Premium


Premium


Premium


Premium


Premium

