- Home >
- Stock Photos >
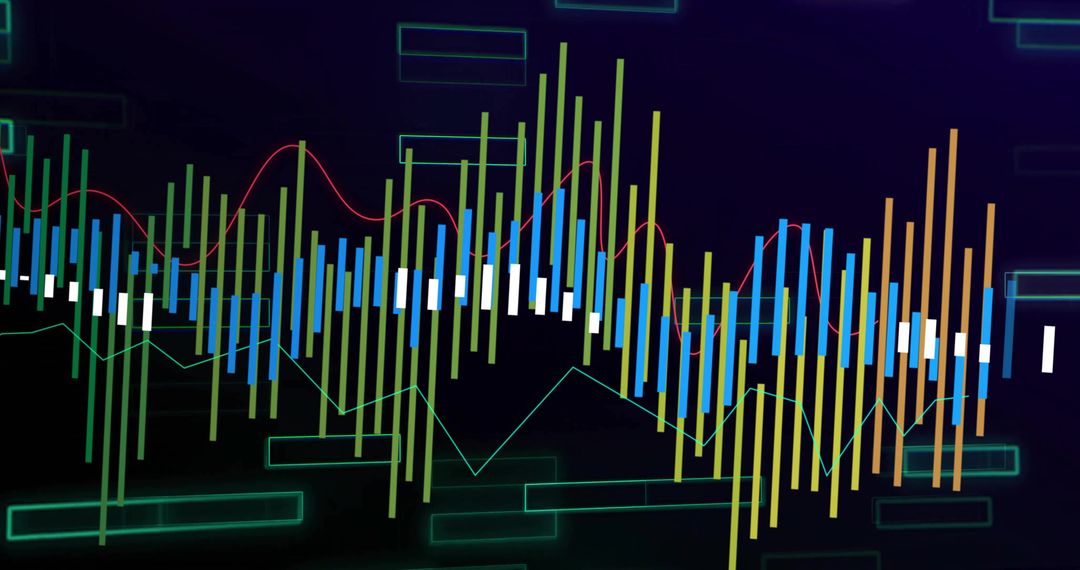
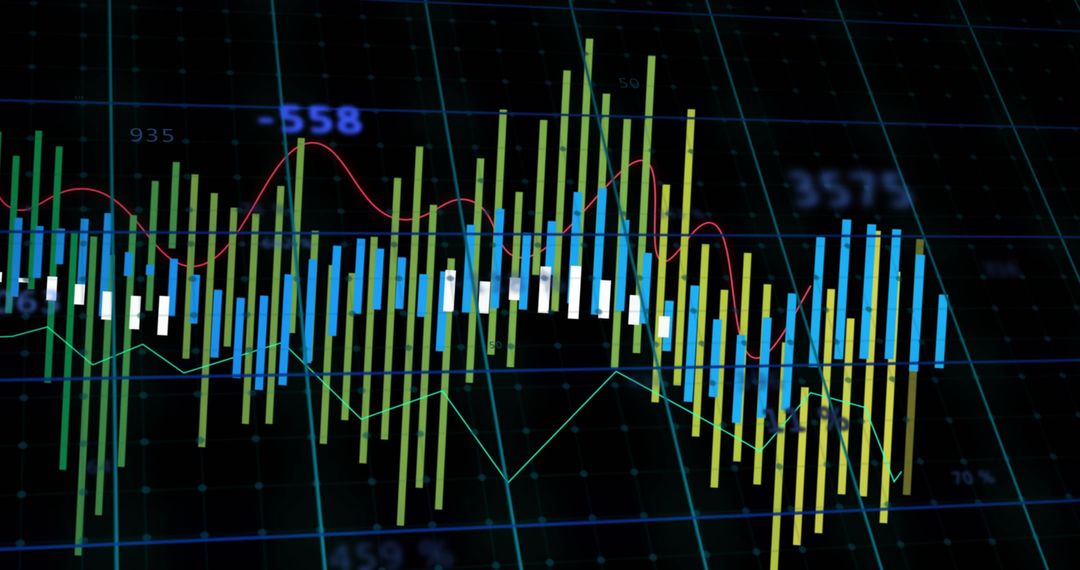
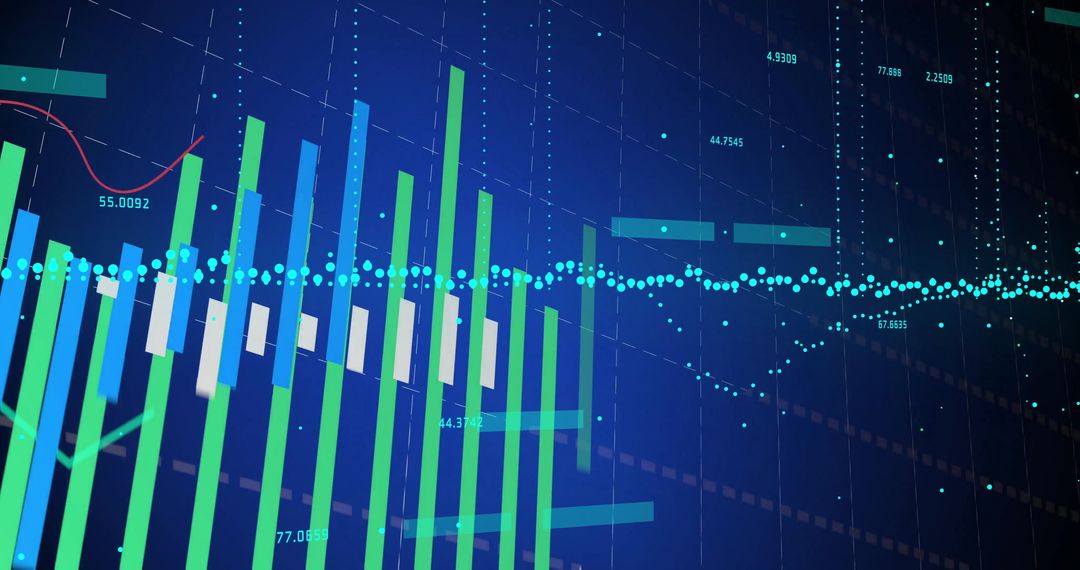
- Neon Candlestick Trading Chart Visualizing Market Trends, Financial Data and Analytics
Neon Candlestick Trading Chart Visualizing Market Trends, Financial Data and Analytics Image

Displaying neon candlestick bars in green, blue and yellow with white candle bodies and overlaid red and cyan moving average lines on dark blue grid. Featuring dynamic vertical bars and line curves conveying volatility, trend changes and market momentum. Working well for financial presentations, trading platform interfaces, fintech websites, investment reports, market research articles and social media posts. Serving as hero banner, report cover, slide background or video overlay with clear space for headline text and data labels. Allowing color adjustments and cropping to fit widescreen banners, square thumbnails or mobile screens.
Powered by 


0
downloads
downloads
Tags:
More
Credit Photo
If you would like to credit the Photo, here are some ways you can do so
Text Link
photo Link
<span class="text-link">
<span>
<a target="_blank" href=https://pikwizard.com/photo/neon-candlestick-trading-chart-visualizing-market-trends-financial-data-and-analytics/32a6a224ae0bf26ecb748031f2f2a1ea/>PikWizard</a>
</span>
</span>
<span class="image-link">
<span
style="margin: 0 0 20px 0; display: inline-block; vertical-align: middle; width: 100%;"
>
<a
target="_blank"
href="https://pikwizard.com/photo/neon-candlestick-trading-chart-visualizing-market-trends-financial-data-and-analytics/32a6a224ae0bf26ecb748031f2f2a1ea/"
style="text-decoration: none; font-size: 10px; margin: 0;"
>
<img src="https://pikwizard.com/pw/medium/32a6a224ae0bf26ecb748031f2f2a1ea.jpg" style="margin: 0; width: 100%;" alt="" />
<p style="font-size: 12px; margin: 0;">PikWizard</p>
</a>
</span>
</span>
Free (free of charge)
Free for personal and commercial use.
Author: Awesome Content
Similar Free Stock Images

Premium


Premium


Premium


Premium


Premium


Premium


Premium


Premium


Premium


Premium


Premium


Premium


Premium


Premium


Premium


Premium


Premium


Premium


Premium


Premium


Premium


Premium


Premium


Premium