1. Home > 
  2. Stock Photos > 
  3. Neon candlestick trading chart with green grid and code overlay for fintech UI

Neon candlestick trading chart with green grid and code overlay for fintech UI Image

Neon candlestick trading chart with green grid and code overlay for fintech UI

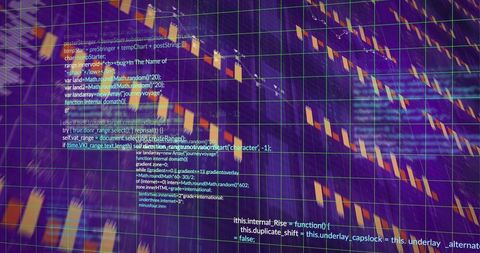
Depicting neon purple backdrop with diagonal motion blur, streaking orange candlesticks, green grid lines, and overlaid white-cyan programming code for high-tech finance aesthetic. Featuring layered data elements and bold color contrast for dynamic trading and fintech themes. Ideal for header banners, fintech websites, trading blog posts, app backgrounds, presentation slides, social media ads, editorial about algorithmic trading, cryptocurrency analysis, investor reports, and marketing materials. Leaving space at right for headline text and call-to-action overlays. Suggested edits include boosting contrast, desaturating background behind text areas, adding semi-transparent overlay to improve legibility, cropping to wide aspect for hero banners, and tight crop for thumbnails. Useful as background for UI mockups, dashboard demos, pitch decks, online courses, and technology reports.

Powered by Adobe logo
Forex trading graph with candlestick chart representing financial market trends on a futuristic blue and purple gradient background - Powered by AdobeStock market blue graph financial trading chart - Powered by AdobeDigital stock market growth concept with arrows and data chart overlays on Bangkok city skyline at night in Asia, symbolizing financial success. - Powered by AdobeFinancial market data displayed as a digital chart with multiple graphs and candlestick patterns, representing stock trends and economic analysis - Powered by AdobeFinancial stock market graph showing candlestick charts and line graphs on a dark blue background, representing investment, trading, and economic data analysis for business growth and decline - Powered by Adobe

Credit Photo

If you would like to credit the Photo, here are some ways you can do so

Free (free of charge)

Free for personal and commercial use.

Author: People Creations

Similar Free Stock Images

Dynamic Stock Market Ticker Display with Financial Graphs
Premium
City street motion blur with overlaid financial candlestick charts
Abstract Digital Finance Graph Interface Display
Abstract Digital Code with Matrix Visualization on Black Background
Financial Data Over Grid Indicating Market Trends and Analytics
Global Financial Data Interface with Rotating Globe Overlay
Premium
Unrecognizable young male trader analyzing stock charts on computer
Digital Code Flow on Grid Background
Global Economic Trends Overlapping Environmental Issues
Data Processing with Abstract Digital Grid
Dynamic Numbers and Data Processing on Digital Grid Background
Premium
Showing chart on wood tabletop with candlestick bars, green line graph and blue dotted trend line
Financial Data Processing Over Digital Grid with Code Elements
Financial Data Processing with Digital Interface Overlay
Analyzing Financial Data on Computer Screens with Headphones in Office
Digital Code Matrix with Programming Language Elements
Premium
Detailed view of a candlestick chart displaying fluctuating financial data, highlighting stock trends over time in a professional trading environment
Futuristic Graphs Process Financial Data Over City Skyline
Dynamic Financial Data with Global Connections and Insights
Financial Data Analysis with Dynamic Growth Charts
Financial Data and Bar Graphs on Digital Interface Background
Premium
Judge's gavel on a blurry financial chart
Binary Code on Digital Grid Background
Futuristic Data Processing with Bar Graph and Digital Interface
Digital Finance Dashboard with Candlestick Chart and Analytics
Server Racks in Data Center with Digital Line Chart Overlay
Premium
Red financial chart with declining trend
Innovative Data Visualization with Digital Line Graphs Interface
Financial Data Dashboard Displaying Dual Trend Lines, Percentage Labels Interactive Metrics
Dark Financial Dashboard Displaying Live Market Charts with 7.23% Callout
Futuristic Neon Financial Dashboard with Candlestick Chart, Purple Cyan Bars and HUD
Digital Stock Market Data Visualization with Rising and Falling Prices
Dynamic Financial Data and Stock Market Interface
Premium
Hands type on keyboard with vibrant financial trading charts displayed overhead.
Digital Data Streaming Over Urban Cityscape
Ukraine Crisis Financial Graphs Overlay
Digital Data Visualization with Global Connection Elements
Digital Financial Data and Technology Visualization
Premium
Stock market graph shows trading with candlestick chart for financial investment analysis in the fluctuating economy
Financial Data and Global Business People in Office Reflecting Virtual Analytics
Financial Data Analytics with Cityscape Backdrop
Dynamic Financial Data on Digital Interface Screen
Cityscape with Digital Graphs Reflecting Data Analytics
Premium
A blurred cityscape at night is overlaid with financial stock market charts, representing the complexities of trading
Stock Market Graphs Overlay on City Skyline Backdrop
Financial Data Analysis with Stock Market Trends and Graphs
City Skyline with Abstract Financial Graph Overlay
Futuristic Financial Data Interface with Graphs and Binary Code
Premium
Focused stock trader analyzing charts on multiple computer screens
Statistics and Data Processing with Graphs and Charts
Digital Data Processing Interfaces on Dark Background
Dynamic Stock Market Chart Overlay with Financial Data Visuals
Financial Graphs and Programming Code Overlay
Premium
Red pixelated candlestick charts on a dark background
Digital Data Visualization and Code on Modern Interface
Finance Data Visualization on Digital Dashboard with Candlestick Bars
Futuristic Digital Interface with Grid Lines and Neonic Elements
Abstract Digital Dashboard Showing Data Analytics with Graphs and Code
Premium
Laptop displays financial charts outdoors with blurred city background sunset.
Holographic financial analytics dashboard displaying neon code with rising line charts
Displaying 3D stacked bar analytics dashboard with multicolor column charts and grid axes
Futuristic Financial Dashboard Showing Layered Market Charts and Colored Trend Lines
Digital Stock Market Data with Graphs and Binary Code
Abstract Digital Financial Data with Graphs and Charts
Digital Financial Data Dashboard with Bar and Line Graphs
Premium
Magnifying glass reveals detailed stock market candlestick chart on financial report, symbolizing investment analysis and business growth. Ai Generated Images
Financial Graphs and Global Business Concept on Blue Background
Financial Data Visualization with Interactive Graphs and Charts
Financial Technology and Digital Data Integration
Abstract Financial Data Display with Analytical Graphs
Premium
Abstract financial chart with bokeh
Digital Financial Data Analysis Over Urban Background
Code Overlay on Cityscape Symbolizing Digital Transformation
Data Analytics and Stock Market Graphs
Financial Data Analytics with Digital Graph Projection
Premium
Stock market downturn with red candlestick chart, declining line graphs, and trading data screen. Ideal for illustrating financial loss, recession, risk, and economic decline in business visuals.
Abstract Grid with Computer Code on Virtual Network Background
Analyzing Financial Data and Economic Trends Concept
Digital Connection Network with Global Business Data Streams
Abstract Digital Data Visuals over Cityscape Background
Premium
A detailed view of a financial chart showing stock market trends with red and green candlestick patterns
Financial Data Analysis Overlaying Cityscape for Business Insights
Abstract Blockchain Data Network with Digital Codes
Financial Market Analysis with Digital Graph Overlay
Digital Code Overlay on Colorful Grid Backdrop
Premium
Financial growth chart with rising stock market data. Colorful trend line and candlestick graph for business analysis.
Social Media Notifications on Futuristic Digital Interface
Futuristic Financial Dashboard with Graphs and Data Visualization
Digital Analytics Graph with Futuristic 3D Interface
Futuristic Digital Dashboard with Fluctuating Data Graph and Code
Premium
Blue-toned financial candlestick charts display market trading data visualization.
Futuristic financial dashboard displaying layered stock charts, red and blue trend lines
Displaying financial growth dashboard with bold upward arrow, line charts, dotted bar analytics
Dynamic Numbers and Data Over Purple Grid Background
Financial Analysis Charts Data With Global Business Stats
Abstract Data Network Background Visualizing Digital Connectivity
Futuristic Digital Data Process with City Skyline
Premium
Abstract financial chart with rising and falling indicators
Digital Representation of Financial Analytics with Graphs and Charts
Data streams, digital interface for global business innovation
Advanced Financial Data and Stock Market Analysis Background
Abstract Digital Data Processing Concept in Network
Premium
Green stock market chart displays financial data on digital screen. Candlestick graph indicates trading trends, economic analysis. Technology monitors investment growth, forex prices, market exchange
Financial Graphs and Cityscape Merging Conceptualizing Economy
City Skyline Merging with Financial Graphs Demonstrating Market Trends
Digital Financial Data Analysis in Urban Environment
Stock Market Trends and Data Analysis over Digital Grid
Premium
Trader analyzing stock market charts depicting trading concept
Soundwaves with Graph Overlays in Data Processing Concept
Dynamic Financial Data Visualization with Digital Code
Futuristic Data Processing in Server Room with Circuit Board Overlay
Digital Interface of Network Connections and Data Processing
Premium
Stock market growth arrow chart green upward financial trend - business success investment profit trading analytics market analysis economic indicators bullish financial growth
Complex Financial Data Visuals with Coding Elements and Charts
Digital Data Analysis Concept with Glowing Graph on Purple Background
Futuristic Data Processing Display with Dynamic Numbers
Futuristic Data Center with Code and LED Lights
Premium
Magnifying glass over a stock market candlestick chart showing financial data and trends on a computer screen
Financial Charts with Blue and Red Lines and Digital Percent Indicators
Digital Financial Analytics Dashboard with Trend Indicators
Futuristic Trading Dashboard Visualizing Stock Market Data with Radial Infographic
Neon Financial Dashboard Displaying Market Charts and 38.67% Marker on Tilted Grid Monitor
Premium
Financial analyst examining market trends with candlestick chart reflection in glasses
Holographic Code Stream Visualizing Real-Time Data Analytics on Neon Grid