
- Home >
- Stock Photos >
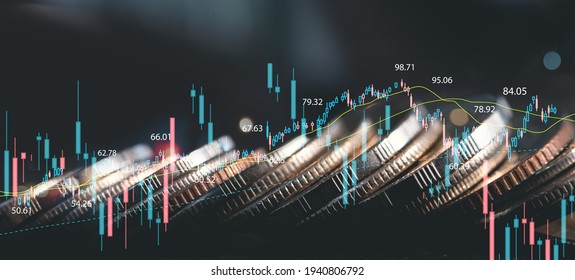
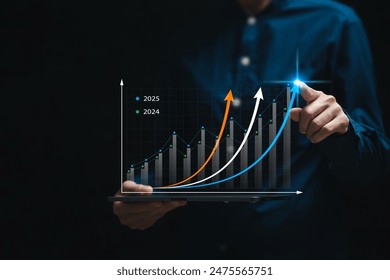
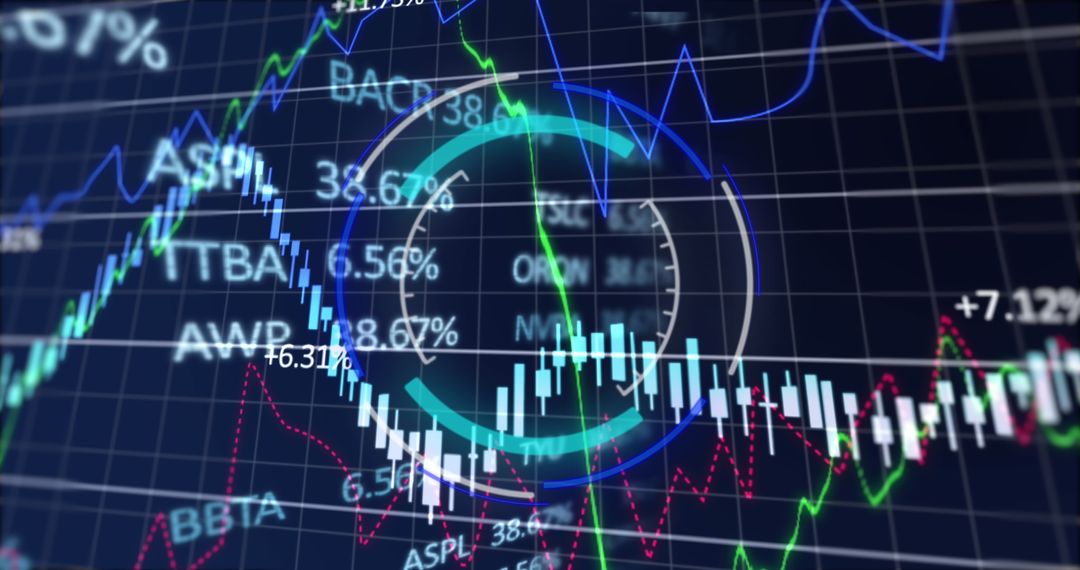
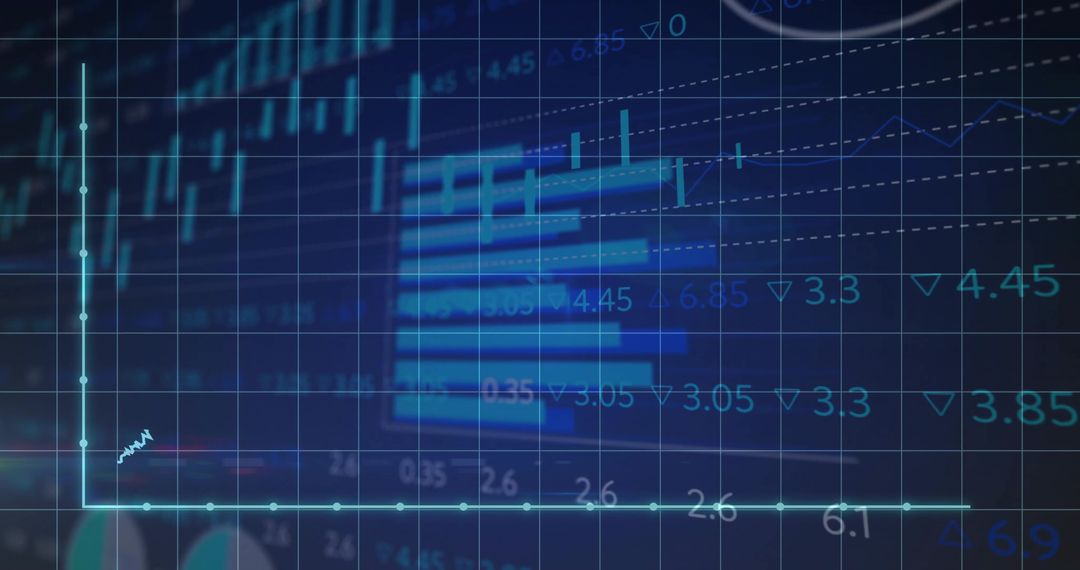
- Neon Circle Highlights Bullish Trend on Digital Dashboard
Neon Circle Highlights Bullish Trend on Digital Dashboard Image

Digital screen showcasing graph with candlesticks surrounded by neon accents embodies finance and data analytics. Ideal for illustrating financial reports, investment articles, or digital trading presentations, emphasizing concepts like growth, technology, and innovation.
Powered by  - Get 15% off with code: PIKWIZARD15


2
downloads
downloads
Tags:
More
Credit Photo
If you would like to credit the Photo, here are some ways you can do so
Text Link
photo Link
<span class="text-link">
<span>
<a target="_blank" href=https://pikwizard.com/photo/neon-circle-highlights-bullish-trend-on-digital-dashboard/bea7fb8d9bb6f8c37792d0fa5574454b/>PikWizard</a>
</span>
</span>
<span class="image-link">
<span
style="margin: 0 0 20px 0; display: inline-block; vertical-align: middle; width: 100%;"
>
<a
target="_blank"
href="https://pikwizard.com/photo/neon-circle-highlights-bullish-trend-on-digital-dashboard/bea7fb8d9bb6f8c37792d0fa5574454b/"
style="text-decoration: none; font-size: 10px; margin: 0;"
>
<img src="https://pikwizard.com/pw/medium/bea7fb8d9bb6f8c37792d0fa5574454b.jpg" style="margin: 0; width: 100%;" alt="" />
<p style="font-size: 12px; margin: 0;">PikWizard</p>
</a>
</span>
</span>
Free (free of charge)
Free for personal and commercial use.
Author: Authentic Images
Similar Free Stock Images

Premium


Premium


Premium


Premium


Premium


Premium


Premium


Premium


Premium


Premium


Premium


Premium


Premium


Premium


Premium


Premium


Premium


Premium


Premium


Premium


Premium


Premium


Premium


Premium

