
- Home >
- Stock Photos >
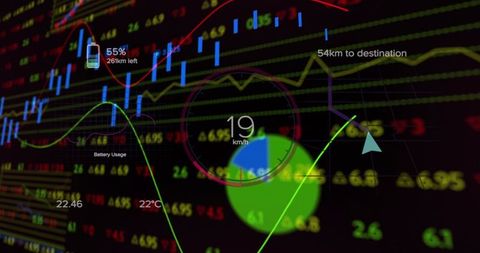
- Neon Circular Shapes Over Stock Market Data Visualization
Neon Circular Shapes Over Stock Market Data Visualization Image

A dynamic image featuring circular neon shapes overlaying stock market data visualization, showcasing global economic statistics and financial analysis. Suitable for illustrating concepts of finance technology, digital trading platforms, and futuristic business analytics. Ideal for websites, presentations, or marketing materials focusing on modern financial instruments and data insights.
Powered by 


downloads
Tags:
More
Credit Photo
If you would like to credit the Photo, here are some ways you can do so
Text Link
photo Link
<span class="text-link">
<span>
<a target="_blank" href=https://pikwizard.com/photo/neon-circular-shapes-over-stock-market-data-visualization/2f830b5bd5ee3bbd89e45a034c8db10d/>PikWizard</a>
</span>
</span>
<span class="image-link">
<span
style="margin: 0 0 20px 0; display: inline-block; vertical-align: middle; width: 100%;"
>
<a
target="_blank"
href="https://pikwizard.com/photo/neon-circular-shapes-over-stock-market-data-visualization/2f830b5bd5ee3bbd89e45a034c8db10d/"
style="text-decoration: none; font-size: 10px; margin: 0;"
>
<img src="https://pikwizard.com/pw/medium/2f830b5bd5ee3bbd89e45a034c8db10d.jpg" style="margin: 0; width: 100%;" alt="" />
<p style="font-size: 12px; margin: 0;">PikWizard</p>
</a>
</span>
</span>
Free (free of charge)
Free for personal and commercial use.
Author: Creative Art
Similar Free Stock Images

Premium


Premium


Premium

Premium


Premium


Premium


Premium


Premium

Premium


Premium


Premium


Premium


Premium

Premium


Premium

Premium


Premium


Premium


Premium

Premium


Premium


Premium


Premium


Premium

Premium


Explore More Free Stock Images