- Home >
- Stock Photos >
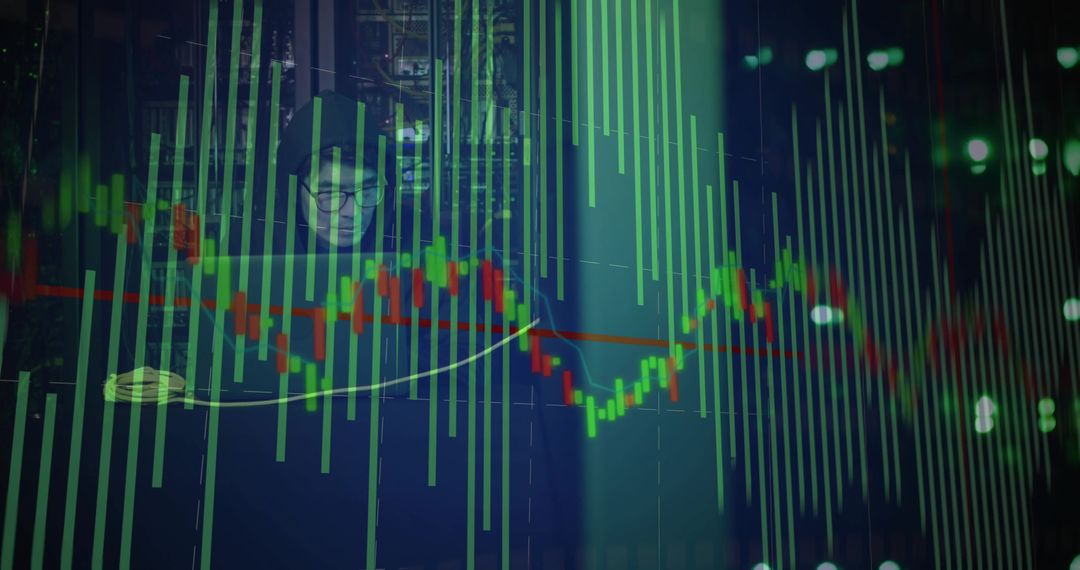
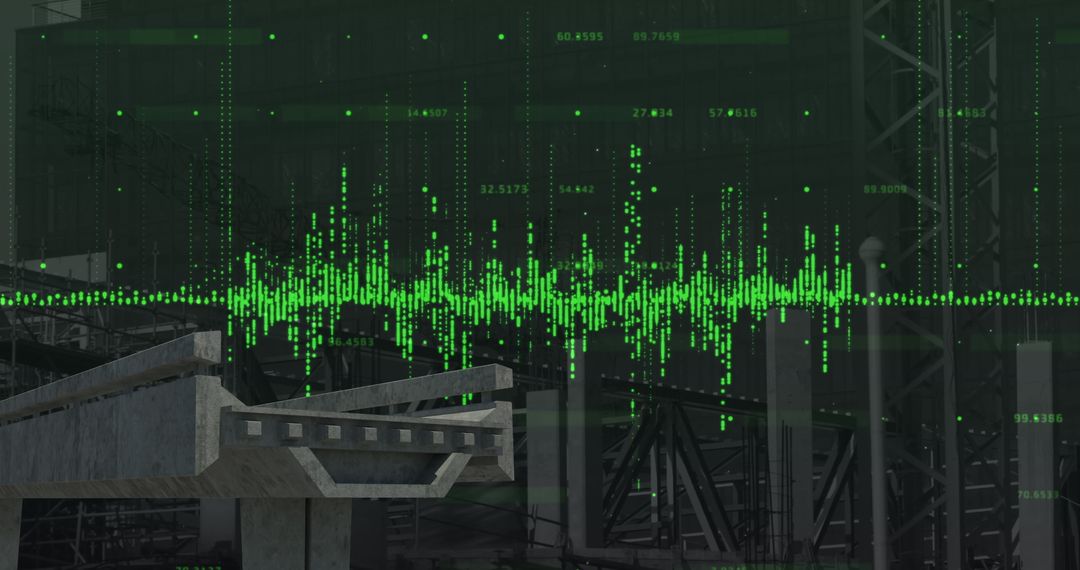
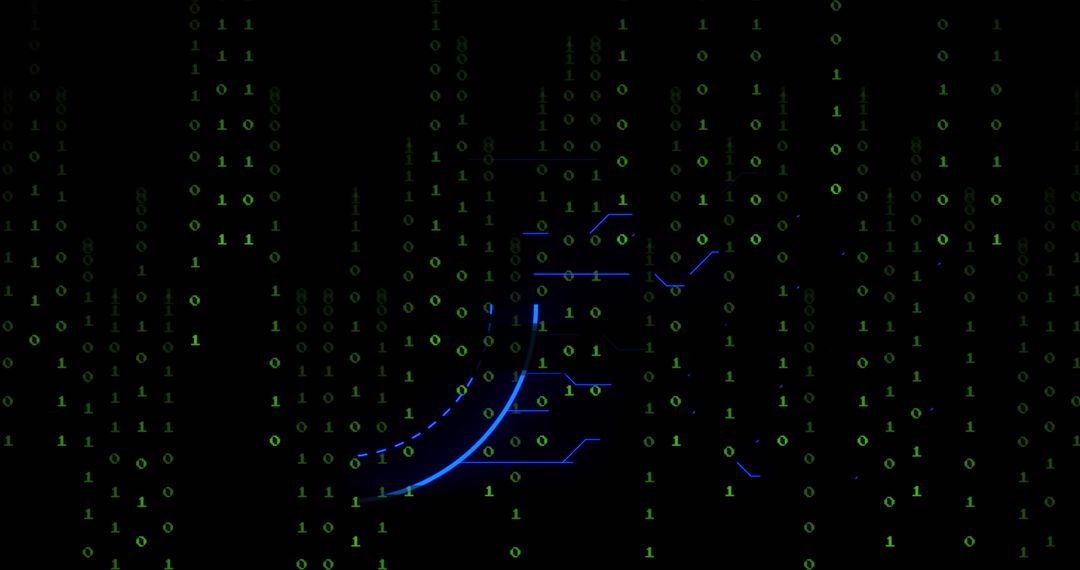
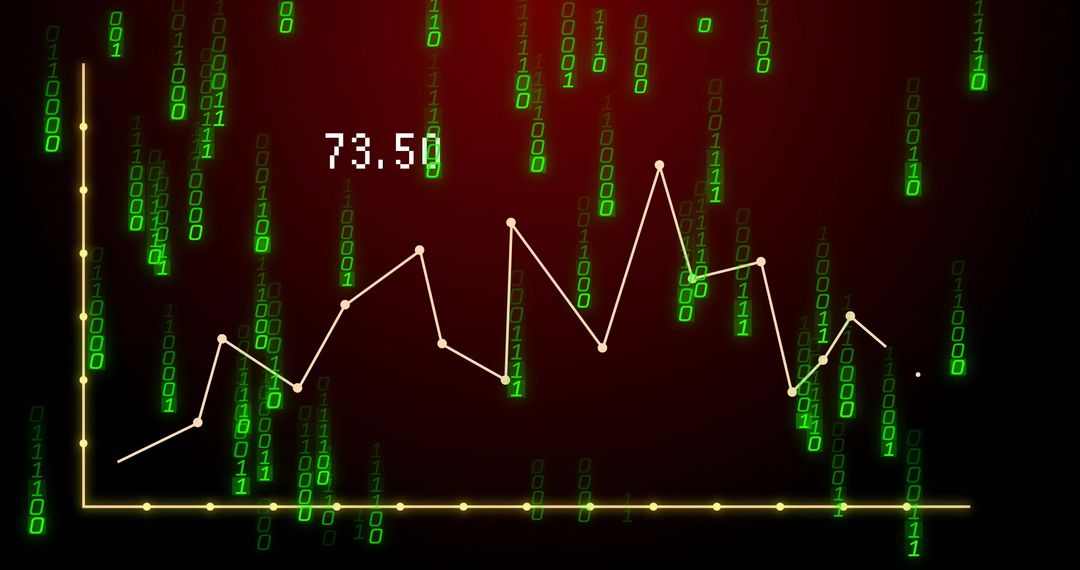
- Neon cyber analytics dashboard with cascading binary code and holographic financial charts
Neon cyber analytics dashboard with cascading binary code and holographic financial charts Image

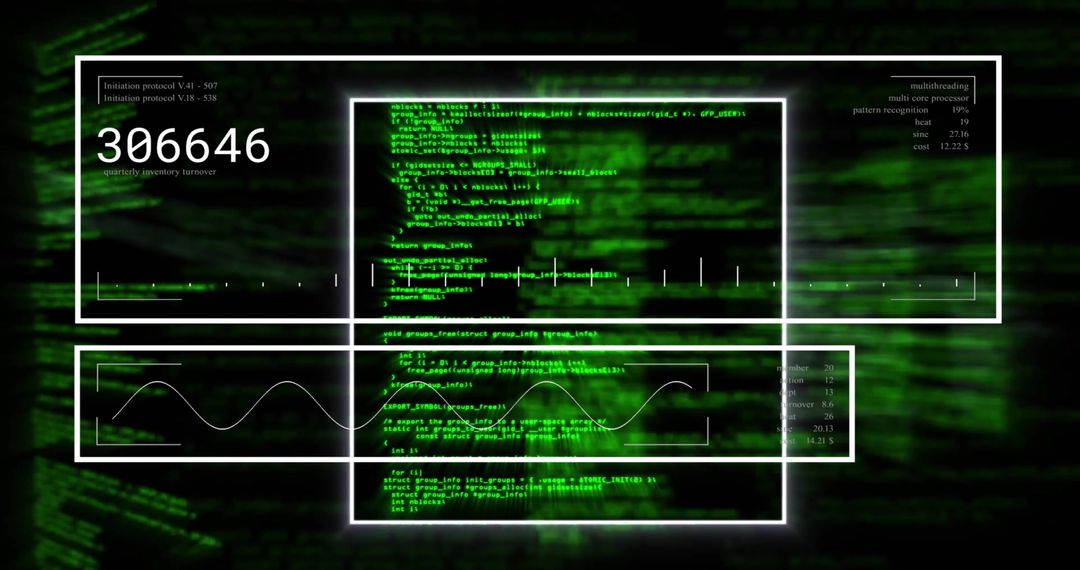
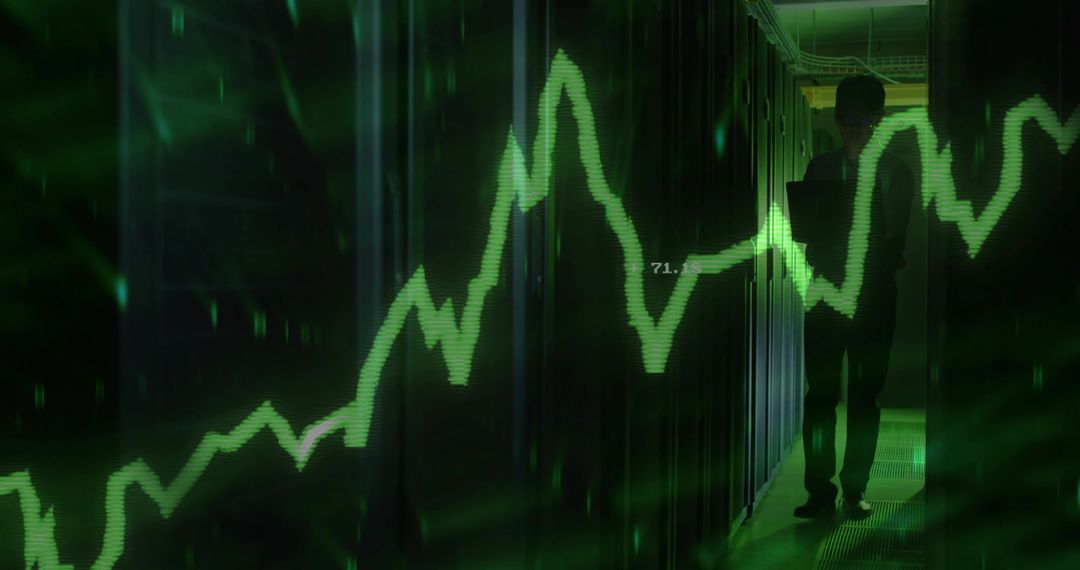
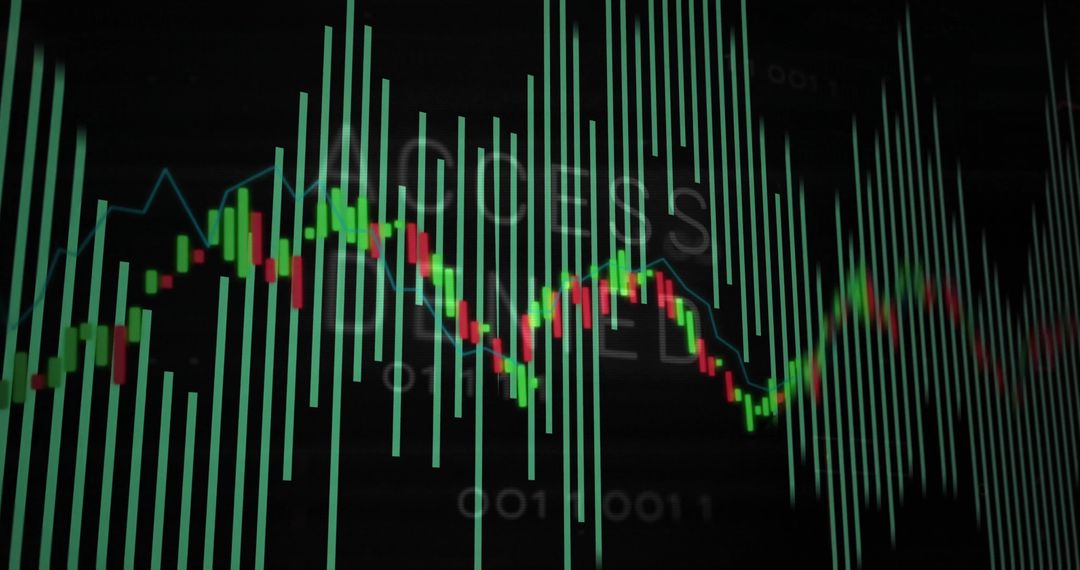
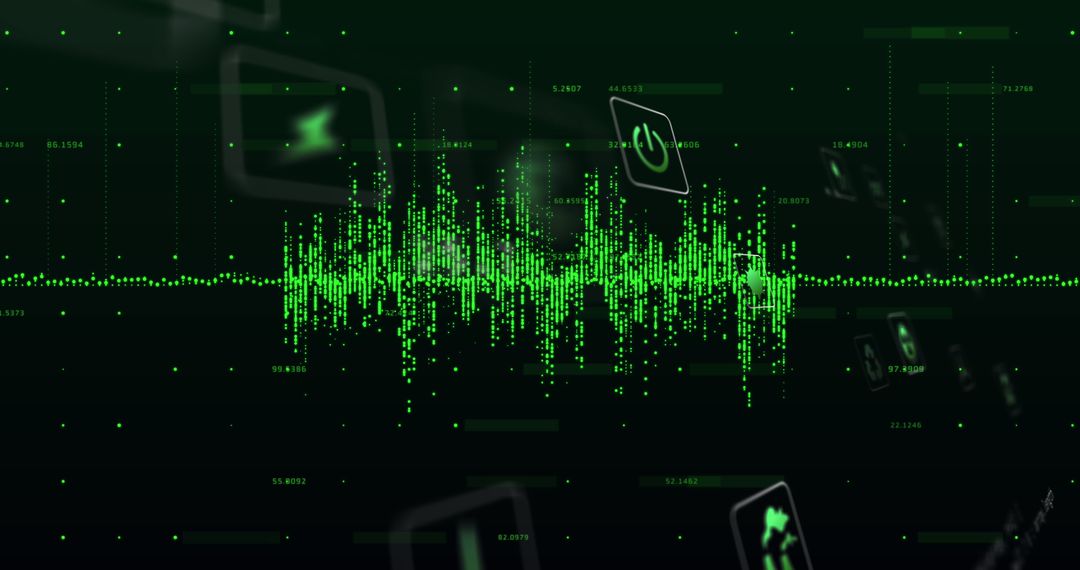
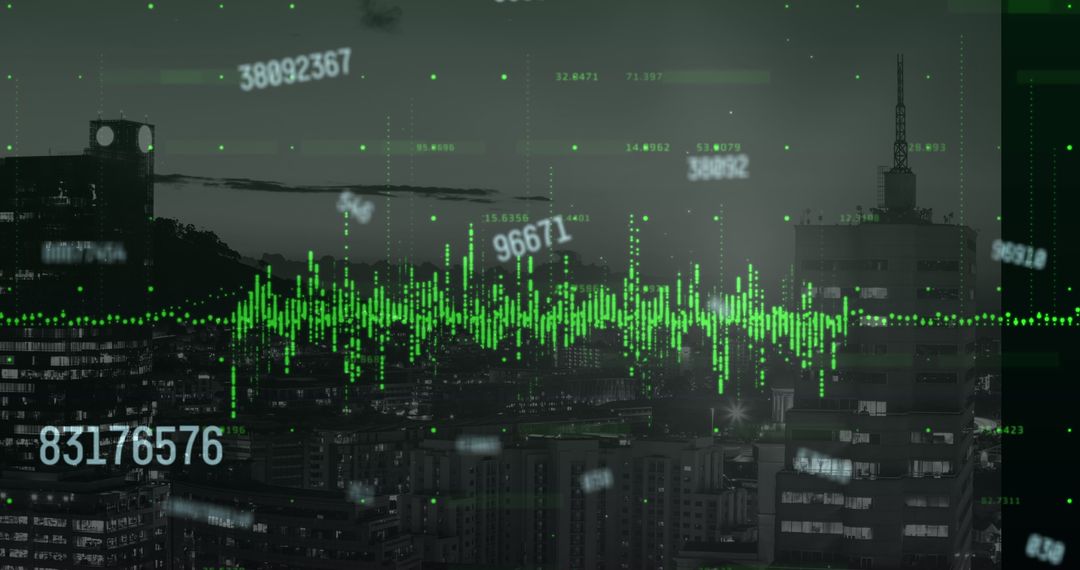
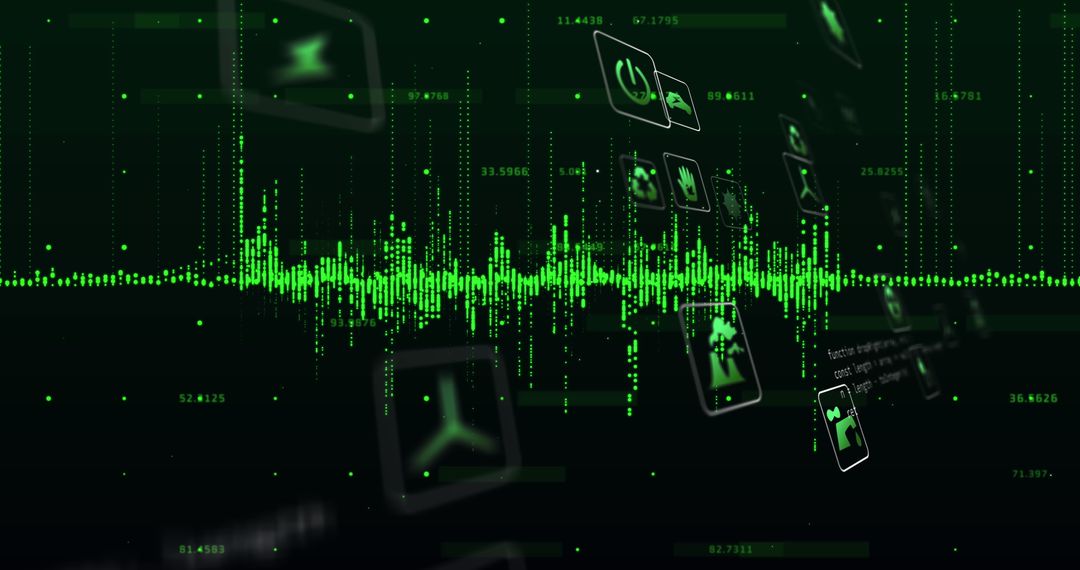
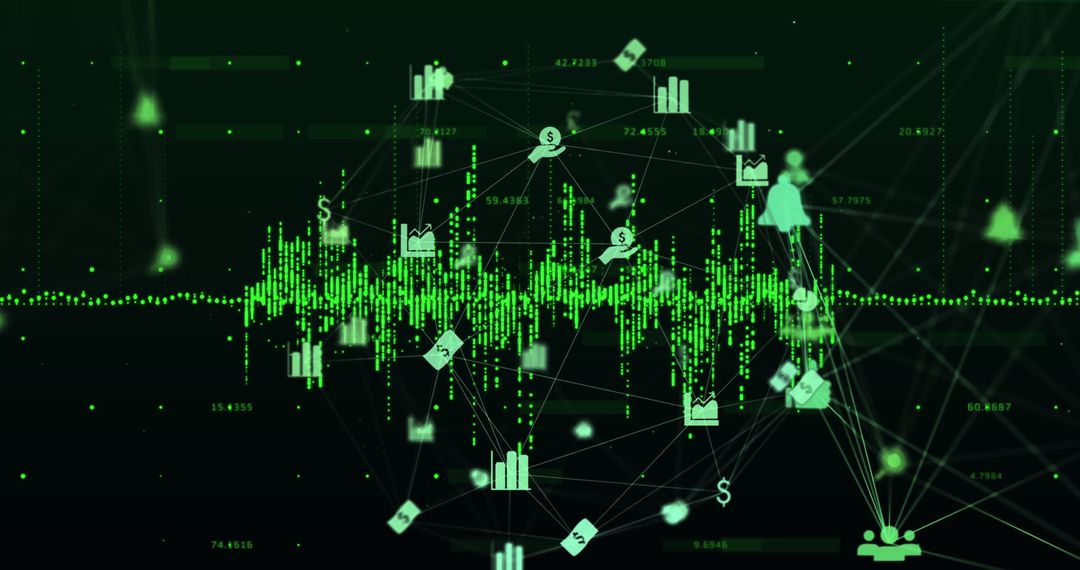
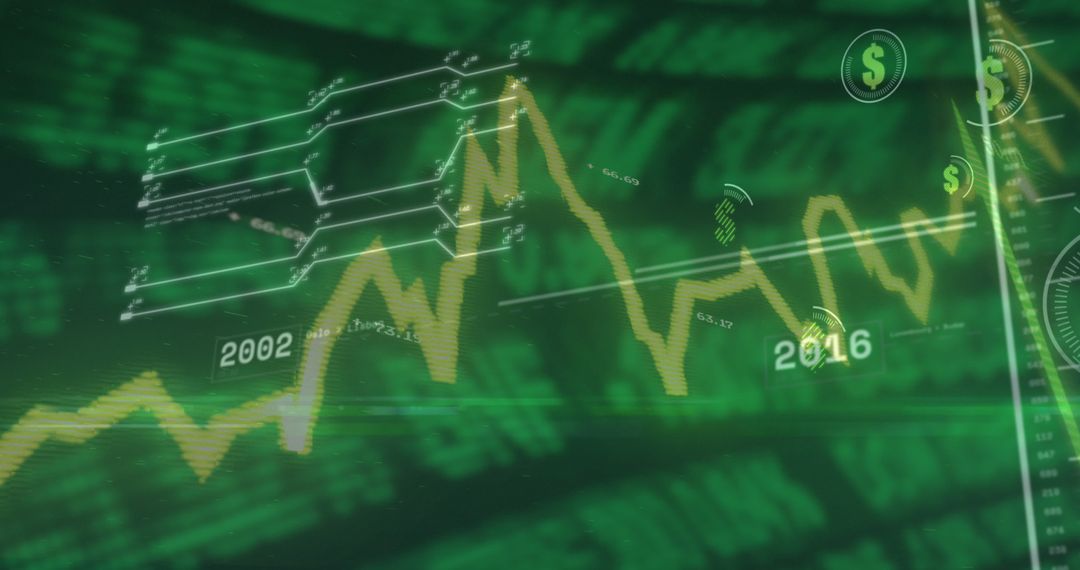
Showing neon green binary digits cascading over translucent holographic charts and red and teal vertical bars, creating layered cybernetic data display. Featuring dark background, subtle grid lines, vertical scan lines for tech noir aesthetic. Suiting fintech branding, cybersecurity articles, stock market analysis, technology presentations, app backgrounds, video overlays, advertising campaigns. Working well in hero banners, website headers, editorial layouts, social posts, pitch decks, promotional materials. Conveying futuristic, secure, data-driven mood while leaving dark negative space for overlaying headlines and metrics. Supporting animated motion graphics, parallax effects, and looping video backgrounds for modern digital design.
Powered by  - Get 15% off with code: PIKWIZARD15


0
downloads
downloads
Tags:
More
Credit Photo
If you would like to credit the Photo, here are some ways you can do so
Text Link
photo Link
<span class="text-link">
<span>
<a target="_blank" href=https://pikwizard.com/photo/neon-cyber-analytics-dashboard-with-cascading-binary-code-and-holographic-financial-charts/3d34d489e737a7c6ef259e8594e72666/>PikWizard</a>
</span>
</span>
<span class="image-link">
<span
style="margin: 0 0 20px 0; display: inline-block; vertical-align: middle; width: 100%;"
>
<a
target="_blank"
href="https://pikwizard.com/photo/neon-cyber-analytics-dashboard-with-cascading-binary-code-and-holographic-financial-charts/3d34d489e737a7c6ef259e8594e72666/"
style="text-decoration: none; font-size: 10px; margin: 0;"
>
<img src="https://pikwizard.com/pw/medium/3d34d489e737a7c6ef259e8594e72666.jpg" style="margin: 0; width: 100%;" alt="" />
<p style="font-size: 12px; margin: 0;">PikWizard</p>
</a>
</span>
</span>
Free (free of charge)
Free for personal and commercial use.
Author: Creative Art
Similar Free Stock Images

Premium


Premium


Premium


Premium


Premium


Premium


Premium


Premium


Premium


Premium


Premium


Premium


Premium


Premium


Premium


Premium


Premium


Premium


Premium


Premium


Premium


Premium


Premium


Premium